Figure 5.
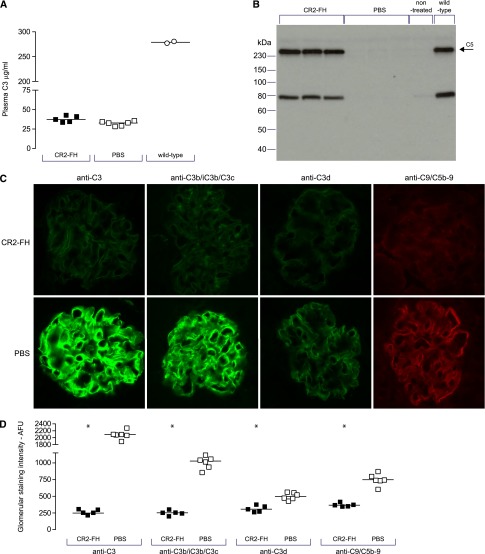
Plasma and glomerular complement profile in mice injected with multiple doses of either CR2-FH or PBS. (A) Plasma C3 remained low in Cfh−/− mice despite repeated injections of CR2-FH. Horizontal bars denote median values. (B) Plasma C5 was analyzed by western blot under nonreducing conditions using 1 µl of mouse plasma. Under these conditions, C5 (band indicated by arrow) was readily detectable in mice injected with CR2-FH and unmanipulated wild-type mice, but absent in PBS-injected and unmanipulated Cfh−/− mice. (C) Representative images of glomerular C3 and C9/C5b-9. Original magnification, ×40. (D) Quantitative immunofluorescence demonstrated a reduction in glomerular C3, C3b/iC3b/C3c, C3d, and C9/C5b-9 in the CR2-FH-injected mice compared with the PBS group. Horizontal bars denote median values. *P=0.004 versus PBS group. Mann–Whitney test. AFU, arbitrary fluorescent units.

