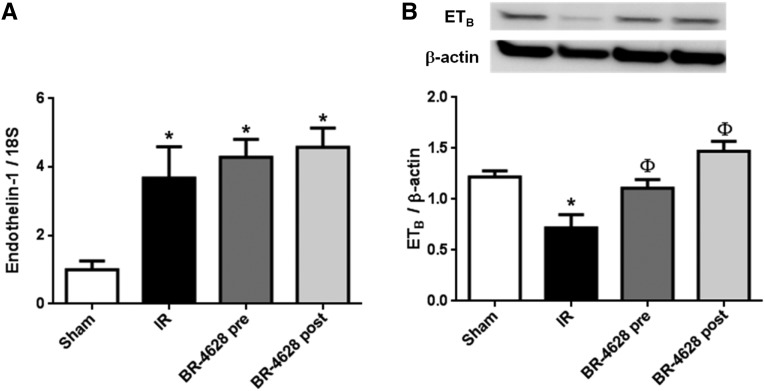
Figure 2.
Effect of renal IR on ET-1 and ETB receptor. (A) mRNA levels of endothelin-1. (B) The upper inset shows a representative western blot analysis for the levels of ETB receptor in the kidney cortex and the lower inset the densitometric analysis. n=5 per group. *P<0.05 versus sham and Φ P<0.05 versus IR.

