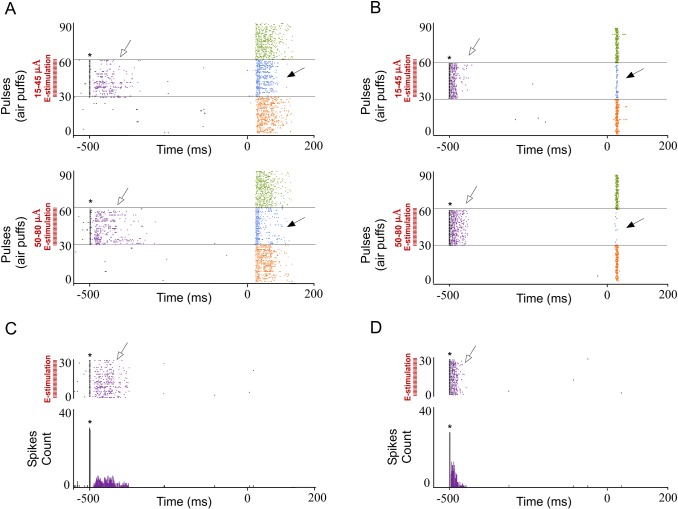
Fig 7. The effect of POm E-stimulation is intensity-dependent.
Response duration and magnitude of cortical neurons decreased with increasing E-stimulation intensity. Raster plots and PSTHs are shown for a sample infragranular (A) and supragranular (B) responses after 15–45 μA (top) and 50–80 μA (bottom). Increasing POm E-stimulation intensity shortened responses more strongly, reducing spikes in the second response component (filled arrows). Control condition before (orange) and after (green) POm E-stimulation condition (blue) are shown. POm E-stimulation was applied 500 ms before pulses 31 to 60. Whisker stimulus presentation was applied at Time 0 ms. POm E-stimulation applied alone elicited orthodromic (open arrows) but not rebound activity in infra- (C) and supragranular layers (D). * indicates E-stimulation artifacts.

