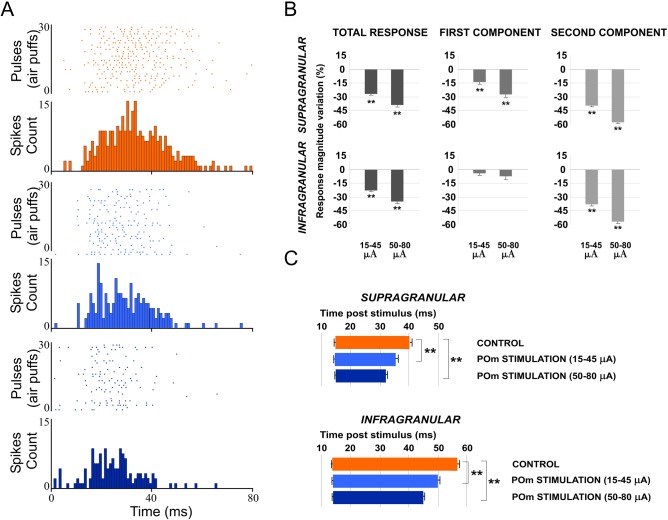
Fig 8. Increasing POm E-stimulation intensity enhances the reduction of second component spikes, shortening the duration of the sensory response.
(A) Raster plots and PSTHs are shown for a supragranular whisker response change after increasing POm E-stimulation intensity before sensory stimulus. Control response (orange), 15–45μA POm E-stimulation (blue) and 50–80 μA POm E-stimulation (dark blue). (B) Response magnitude variation (%) with different POm E-stimulation intensities before sensory stimulus. (C) Increasing POm E-stimulation intensity before stimulus shortened the responses offset latencies. Horizontal bars represent response duration. In infragranular layers, the numbers of single units analyzed in B and C are: n = 57. In supragranular, n = 53.

