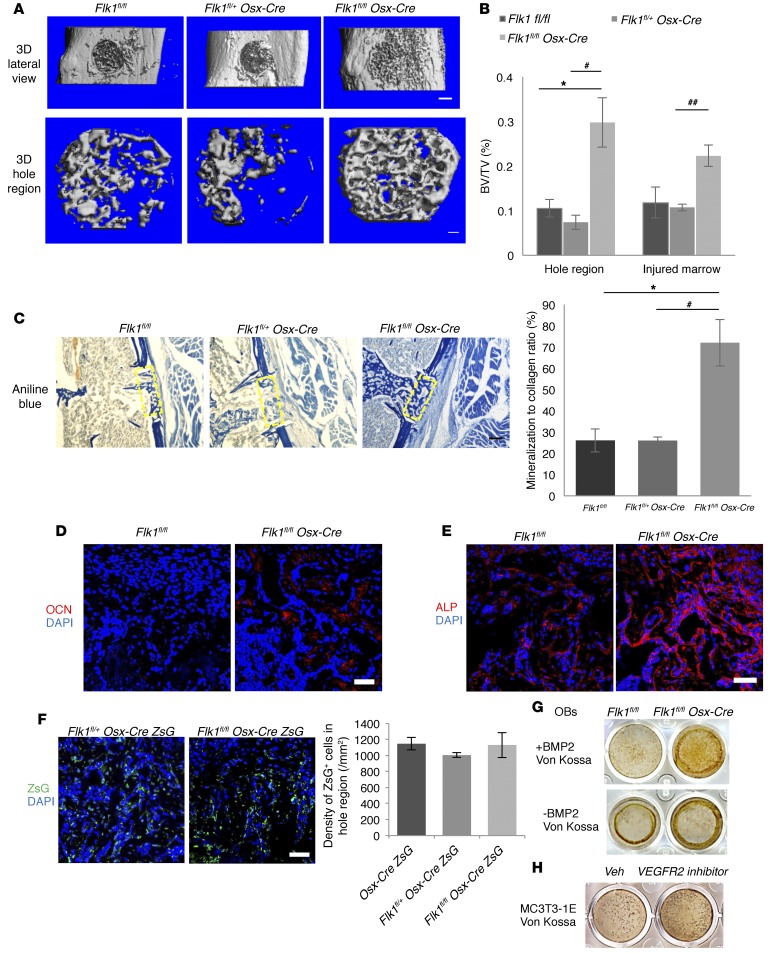
Figure 9. Deletion of Vegfr2 in osteoblastic cells increases their maturation and mineralization during bone repair at PSD7.
(A) 3D reconstruction of injured tibiae (top panel; scale bar: 500 μm) and mineralized bone in hole region (lower panel; scale bar: 100 μm). Representative images of 6–7 mice for each genotype. BVs in hole of Flk1fl/fl (0.0120 ± 0.0024 mm3) and Flk1fl/+ Osx-Cre mice (0.0082 ± 0.0016 mm3) not statistically different, but increased (0.0330 ± 0.0077 mm3) in Flk1fl/fl Osx-Cre mice; P < 0.05 vs. Flk1fl/fl. Tb.N (Tb.N/mm) increased (13.36/mm ± 1.32/mm) and trabecular spacing (Tb.Sp) decreased (0.079 ± 0.011 mm), in Flk1fl/fl Osx-Cre compared with Flk1fl/fl mice (7.08/mm ± 0.77/mm and 0.160 ± 0.023 mm); P < 0.01 (Tb.N), P < 0.05 (Tb.Sp). (B) BV/TV of mineralized bone formed in hole and wounded marrow of control and Vegfr2-deficient mice. (C) Reduced aniline blue staining in hole region (yellow rectangles) of Flk1fl/+ Osx-Cre (21.86% ± 1.53%) compared with Flk1fl/fl (36.70% ± 5.47%) mice; P < 0.05, but increased in Flk1fl/fl Osx-Cre (37.75% ± 10.99%) compared with Flk1fl/+ Osx-Cre mice; P < 0.05. Right: Increased mineralization/collagen ratio in Flk1fl/fl Osx-Cre mice. (D and E) Increased anti-OCN (2.8% ± 0.6%) and anti-ALP staining (20.0% ± 3.4%) in hole region of Flk1fl/fl Osx-Cre compared with Flk1fl/fl mice (0.6% ± 0.4% and 6.7% ± 1.8%); P<0.05 (OCN) and P < 0.01 (ALP). (F) Similar density of ZsG+ cells in hole region of Osx-Cre/ZsG, Flk1fl/+ Osx-Cre/ZsG, and Flk1fl/fl Osx-Cre/ZsG mice. (G) Von Kossa staining of osteoblasts cultured for 21 days in mineralization medium with or without BMP2. (H) Von Kossa staining of MC3T3-1E cells cultured for 21 days in mineralization medium containing 100 μM VEGFR2 kinase inhibitor or vehicle (Veh). Data are representative of 3 independent experiments (G and H). Scale bars: 200 μm (C), 50 μm (D–F); n= 6–7 (B–E); n= 4–6 (F). ANOVA with Tukey’s post-hoc test (A–C and F) and unpaired 2-tailed Student’s t test (D and E) were used. *, #P < 0.01; ##P < 0.05. *, vs. Flk1fl/fl. #,##vs. Flk1fl/+ Osx-Cre.

