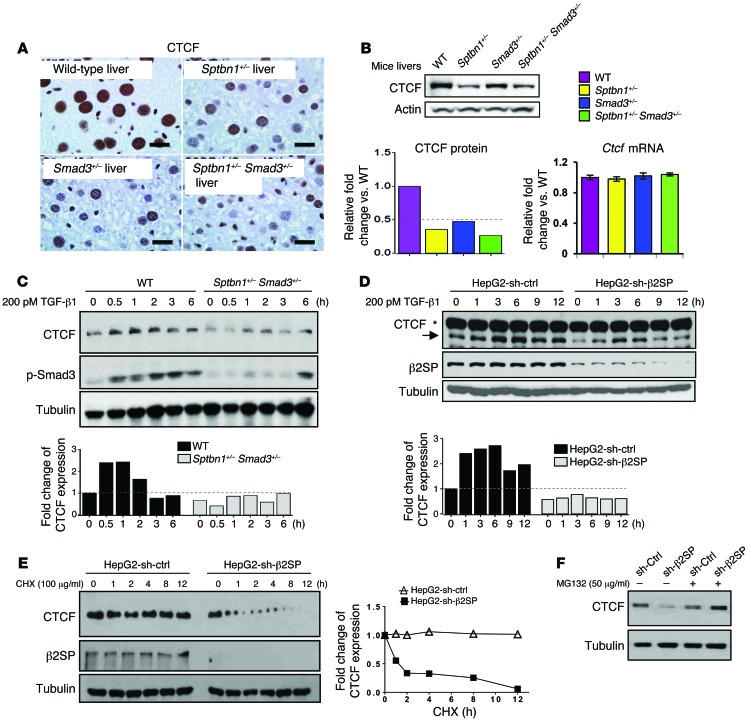
Figure 4. TGF-β/SMAD3/β2SP upregulates CTCF.
(A) Decreased CTCF levels in Sptbn1+/–, Smad3+/–, and Sptbn1+/– Smad3+/– mouse livers were observed. CTCF levels were detected by immunohistochemical analysis in wild-type, Sptbn1+/–, Smad3+/–, and Sptbn1+/– Smad3+/– mouse livers. Scale bars: 20 μm. (B) CTCF protein expression levels but not mRNA levels were decreased in Sptbn1+/–, Smad3+/–, and Sptbn1+/– Smad3+/– mouse livers. CTCF protein levels were detected by immunoblotting analysis. Ctcf mRNA levels were detected by Q-PCR. Error bars are shown as SD. (C and D) TGF-β increased CTCF protein expression levels in Sptbn1+/– Smad3+/– MEFs (C) and in β2SP-knockdown HepG2 cells (D). MEFs or HepG2 cells were treated with 200 pM TGF-β1 for the indicated times. Cell lysates were immunoblotted with the indicated antibodies. The density of CTCF and the integrated optical density were measured. Asterisk designates nonspecific bands. (E) Knockdown β2SP decreased CTCF protein stability. HepG2–sh-Ctrl or HepG2–sh-β2SP cells were treated with 100 μg/ml cycloheximide (CHX) for the indicated times. The density of CTCF and the integrated optical density were measured. The turnover of CTCF is indicated graphically. (F) β2SP-mediated CTCF downregulation was proteasome dependent. HepG2–sh-Ctrl or HepG2–sh-β2SP cells were treated with or without 50 μg/ml MG132 for 6 hours. Cell lysates were immunoblotted with CTCF antibodies. Data are representative of 3 (B–E) and 2 (F) independent experiments.

