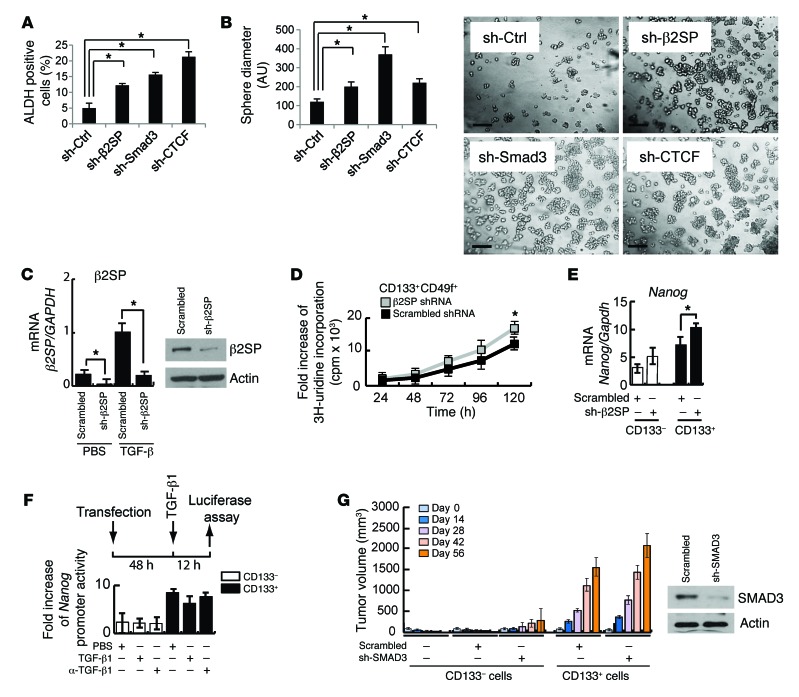
Figure 8. Dysfunction of the β2SP/SMAD3/CTCF complex increases stem-like properties and promotes TIC tumorigenesis.
(A) Increased ALDH population in β2SP, SMAD3, or CTCF knockdown cells. The positive ALDH cells were isolated from HepG2–sh-Ctrl, HepG2–sh-β2SP, HepG2–sh-SMAD3, or HepG2–sh-CTCF cells and then measured by flow cytometry. Bar graph data represent percentages of ALDH-positive cells. *P < 0.001, 1-way ANOVA with post-hoc Bonferroni’s test. (B) Knockdown of β2SP, SMAD3, or CTCF increases sphere formation. HepG2–sh-Ctrl, HepG2–sh-β2SP, HepG2–sh-SMAD3, or HepG2–sh-CTCF cells were cultured in serum-free DMEM/F12 medium with growth factors (10 ng/ml of EGF and FGF) for 6 days. Quantification of the spheres is shown. *P < 0.001, 1-way ANOVA with post-hoc Bonferroni’s test. Representative images of spheres were taken at day 6. Scale bars: 5 μm. (C) β2SP knockdown efficiency is shown in CD133+CD49f+ TICs isolated from liver tumors of alcohol-fed HCV Ns5a Tg mice. β2SP protein levels are effectively silenced by transduction of lentiviral shRNA in TICs (insets). *P < 0.01, Student’s t test. (D) β2SP knockdown increases CD133+CD49f+ TIC proliferation. Cell proliferation rates were determined by measuring 3H-uridine incorporation. *P < 0.05, Student’s t test (vs. scrambled control). (E) β2SP knockdown increases Nanog expression levels in CD133+ TICs. The mRNA expression levels of Nanog were measured by Q-PCR. *P < 0.05, Student’s t test. (F) Nanog promoter activity is higher in CD133+ TICs, while TGF-β stimulation does not significantly inhibit Nanog promoter activity in these TICs. Nanog promoter luciferase assays were performed. (G) SMAD3 knockdown enhanced subcutaneous tumor growth of TICs in a xenograft NOG mouse model. SMAD3 protein levels are effectively silenced by transduction of lentiviral shRNA in TICs (insets). Error bars are shown as SD. Each result shown is representative of 3 independent experiments (A–G).

