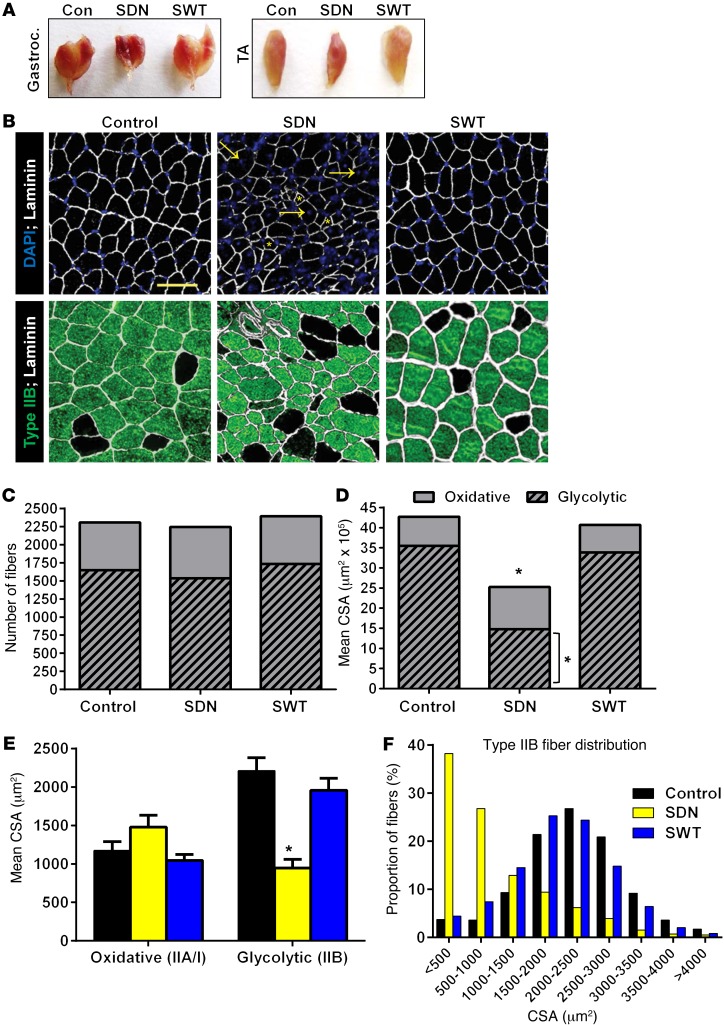
Figure 5. Muscle morphology in SNARK transgenic mice.
(A) Images of gastrocnemius and TA muscles taken from 58-week-old SDN mice, SWT mice, and wild-type littermates. (B) Cross sections (6 μm) were taken from TA muscles, muscle sections were stained with anti-laminin (white), and nuclei were visualized with DAPI (blue). Glycolytic fibers were stained with anti–myosin heavy chain IIB (green). Compared with those of wild-type and SWT mice, SDN muscles displayed small, atrophic fibers (yellow, asterisks) and large fibers with centralized nuclei (yellow, arrows) indicating muscle regeneration. Original magnification, ×200; scale bar: 50 μm. (C) The number of glycolytic (type IIB) and oxidative (unstained) fibers were counted for each section, and (D) the CSA of each fiber was measured. (E) Mean CSA was calculated for oxidative and glycolytic fibers from each genotype, and (F) the size distribution of glycolytic fibers was plotted. *P < 0.05 vs. control determined by 1-way ANOVA and Bonferroni post-hoc testing. Data for all panels were quantified from sections taken from n = 5 animals per group. Error bars indicate mean ± SEM.

