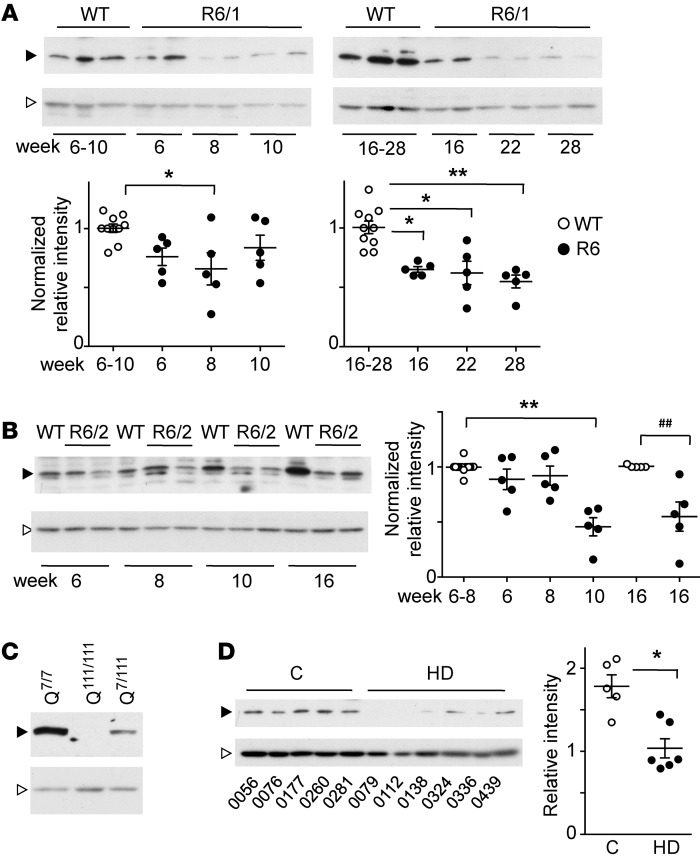
Figure 1. DREAM expression is reduced in murine in vivo and in vitro HD models and in HD patients.
(A and B) Western blot analysis of DREAM protein levels in striatum from R6/1 (A) and R6/2 mice (B) and corresponding WT littermates at the indicated weeks after birth. Five mice were analyzed in each group. Black arrowheads, DREAM immunoreactive band; white arrowheads, nonphosphorylated ERK1/2 loading control. After densitometric analysis, band intensity ratio vs. loading control was normalized to corresponding WT. Significant differences compared with WT were calculated using 1-way ANOVA (Kruskal-Wallis), followed by Dunnett’s multiple comparisons test or Mann-Whitney U test (##P = 0.0079) when comparing 2 groups (in B, 16 weeks). *P < 0.05; **P < 0.01. (C) Western blot analysis of DREAM levels in STHdhQ cells. DREAM-specific band intensity is reduced in heterozygous (Q7/111) compared with WT (Q7/7) cells and is below the detection limit in homozygous (Q111/111) cells. Black arrowhead, DREAM immunoreactive band; white arrowhead, α-tubulin loading control. (D) Western blot analysis of DREAM levels in striatal samples from controls (n = 5) and HD patients (n = 6). The corresponding brain bank code number (BCPA-) is shown below each lane. The DREAM-specific band (black arrowhead) was scanned, and intensity ratio vs. loading control (nonphosphorylated Erk1/2, white arrowhead) is shown (right). **P = 0.0019, Mann-Whitney U test. Black arrowheads (A–D) indicate the DREAM-specific band (Ab 670); white arrowheads show the loading control (ERK1/2 in A, B, and D; β-actin in C).

