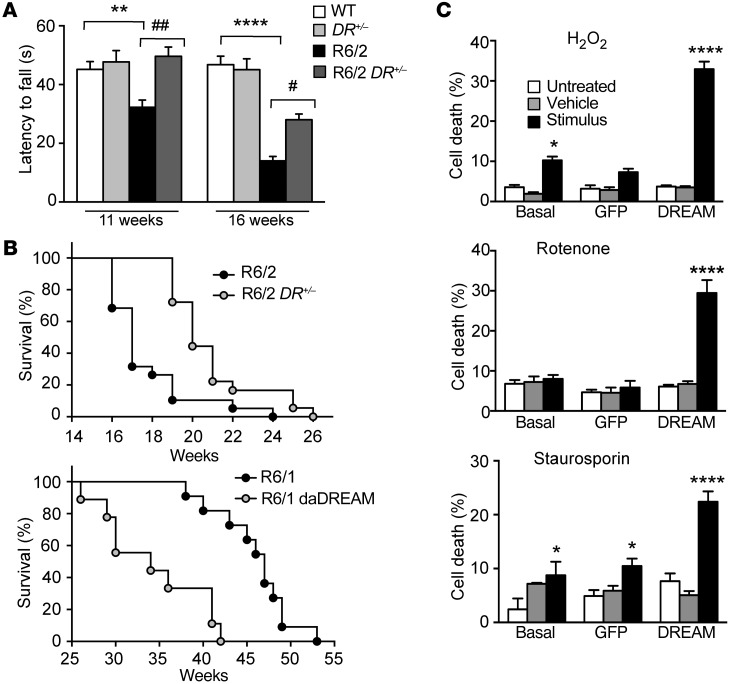
Figure 2. Reduced DREAM protein level is a neuroprotective response.
(A) Latency to fall in the rotarod test for mice (n = 24–30) of the indicated genotypes at 11 and 16 weeks of age. Significant differences between genotypes were found by 2-way ANOVA followed by Tukey’s test. **P < 0.01, ****P < 0.0001 vs. WT; #P < 0.05, ##P < 0.01 vs. R6/2. (B) Percentage survival (Kaplan-Meier) of R6/2 (n = 32) and R6/2 DREAM+/– (R6/2 DR+/–) (n = 43) (upper panel) or R6/1 (n = 11) and R6/1 daDREAM mice (n = 9) (lower panel). Curves were compared by log-rank (Mantel-Cox) test (P < 0.0001). (C) Cell death as a percentage of maximum LDH released for noninfected STHdhQ111/111 cells, cells infected with a GFP-expressing lentivirus, or cells infected with a DREAM-GFP–expressing lentivirus. For each group, cell death was compared for untreated cells vs. cells exposed to vehicle or to the indicated stimuli: H2O2 (10 μM), rotenone (100 nM), or staurosporine (5 nM). Data (mean ± SEM) are derived from 3 independent experiments in quadruplicate. Statistical significance was analyzed by 2-way ANOVA followed by Tukey’s test. *P < 0.05, ****P < 0.0001 vs. basal or vs. GFP groups.

