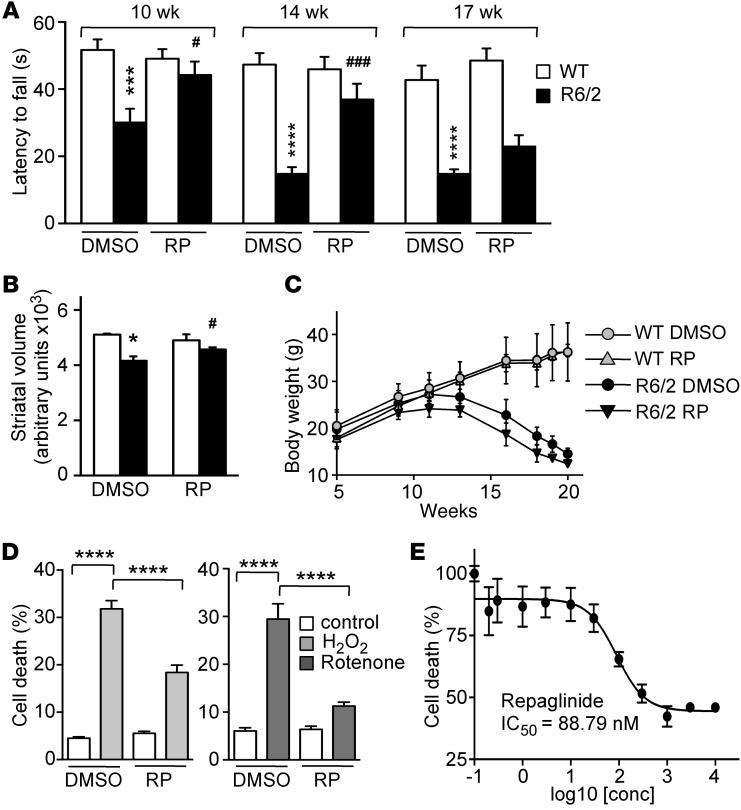
Figure 4. Repaglinide ameliorates the HD phenotype.
(A) Latency to fall in the rotarod test of mice of the indicated genotypes and age, exposed chronically to vehicle (DMSO) or repaglinide. DMSO-treated R6/2 mice were significantly different from WT controls at all ages, and repaglinide-treated R6/2 differed from repaglinide-treated WT mice at all ages except at 17 weeks, when there was only a slight, nonsignificant improvement. ***P < 0.001, ****P < 0.0001 vs. WT; #P < 0.05, ###P < 0.001 vs. R6/2 (2-way ANOVA, Sidak’s post test; n = 13–17). (B) Nuclear magnetic resonance analysis of striatal volume in 18-week-old mice of indicated genotypes. *P < 0.0159, WT-DMSO vs. R6/2-DMSO; #P < 0.0303, R6/2-DMSO vs. R6/2-repaglinide (Mann Whitney U test; n = 4–7). (C) Body weight progression in male mice of the indicated genotypes exposed to DMSO or repaglinide. No significant differences (2-way ANOVA, Tukey’s multiple comparison test) were found within groups of untreated or repaglinide-treated mice (n = 10). (D) Cell death, as a percentage of maximum LDH released by DREAM-expressing STHdhQ111/111 cells. Cells were exposed to vehicle or repaglinide (100 nM) and stimulated with H2O2 (10 μM) or rotenone (100 nM). Data from 3 (rotenone) or 7 (H2O2) independent experiments in quadruplicate were analyzed by 2-way ANOVA followed by Tukey’s test. ****P < 0.0001. (E) Effect of repaglinide on LDH release from N2a neuroblastoma cells (n = 4) after H2O2 exposure (20 μM). A 4-parameter (variable slope) nonlinear curve fitting resulted in an IC50 of 88.79 ± 1.39 nM for repaglinide.

