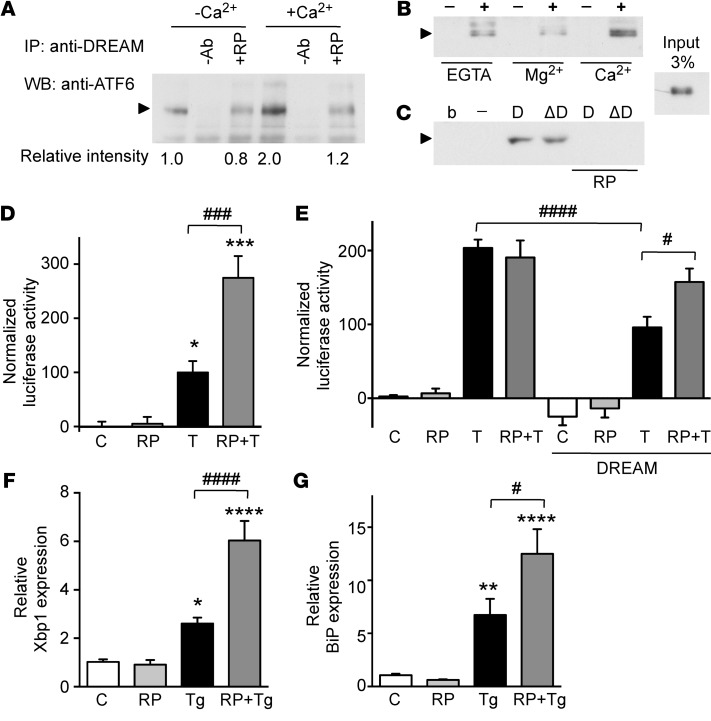
Figure 5. Repaglinide blocks DREAM-ATF6 interaction and regulates derepression of ATF6 targets.
(A) Coimmunoprecipitation of endogenous ATF6 and DREAM proteins in STHdhQ7/7 cell lysates. Immunoprecipitated band (arrowhead) corresponds to full-length ATF6. Coimmunoprecipitation was performed in the absence or presence of Ca2+ (2 mM) and/or repaglinide (200 nM). Bottom, optical density of the ATF6 band from 3 independent immunoprecipitations is shown as mean relative intensity to the immunoprecipitate in the absence of Ca2+. (B) Pull-down using GST (–) and GST-DREAM1-256 (+) proteins as bait and in vitro–translated Nt-ATF61–376 as target in the presence of EGTA, Mg2+, or Ca2+ (2 mM). The experiment was repeated twice. (C) Pull-down in the presence of Ca2+ using GST (–), GST-DREAM1–256 (D), or N-terminal GST-DREAM1–90 (ΔD) proteins as bait and in vitro–translated Nt-ATF61–376 as target, alone or with repaglinide (200 nM). b, empty beads. The experiment was repeated twice. Input for B and C was 3%. (D) Luciferase reporter assays in STHdhQ7/7 cells transiently transfected with reporter plasmid p5×ATF6-GL3 and stimulated with tunicamycin (T) (200 ng/ml) alone or with repaglinide (100 nM). *P < 0.05, ***P < 0.001, vs. control; ###P < 0.001 for tunicamycin-stimulated cells alone or with repaglinide (1-way ANOVA, Bonferroni’s post-test). (E) Luciferase reporter assay in WT or DREAM-overexpressing HeLa cells stimulated as in C. ####P < 0.0001, tunicamycin-stimulated HeLa cells alone and with DREAM; #P < 0.05, tunicamycin-stimulated DREAM-expressing HeLa cells alone or with repaglinide (1-way ANOVA, Bonferroni’s post-test). (F and G) Real-time qPCR analysis of XBP1 and BIP mRNAs after stimulation (14 hours) with thapsigargin (Tg) (200 nM) of STHdhQ7/7 cells alone or with repaglinide (200 nM; 1 hour). Values are normalized relative to HPRT mRNA levels. The experiment was repeated 3 times in triplicate. Significant differences were determined as in D: **P < 0.01, ****P < 0.0001, vs. control; #P < 0.05, ####P < 0.0001 for thapsigargin-stimulated cells alone or with repaglinide (1-way ANOVA, Bonferroni’s post-test).

