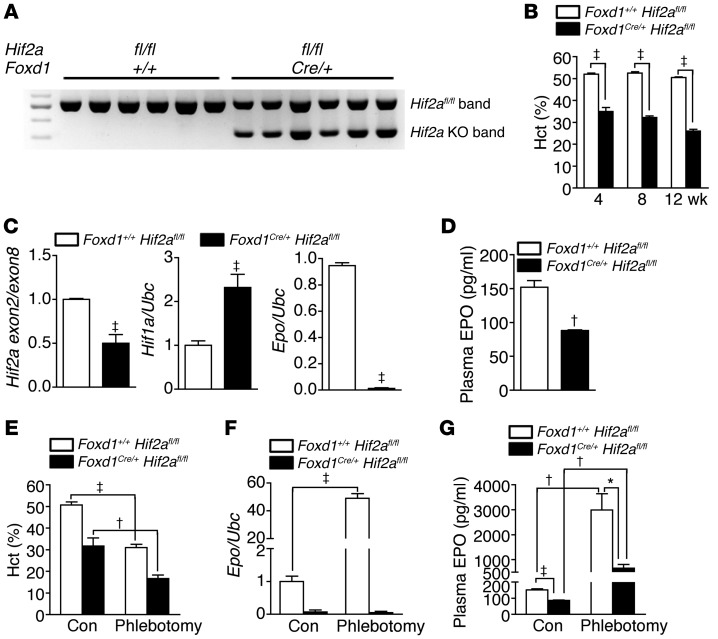
Figure 2. HIF2α regulates EPO production in kidney pericytes.
(A) PCR products using kidney genomic DNA and genotyping primers for Hif2afl/fl mice. The knockout band was confirmed in Foxd1Cre/+ Hif2afl/fl mice. Foxd1+/+ Hif2afl/fl control mice only show the Hif2afl/fl band. (B) Analyses of hematocrit in Foxd1+/+ Hif2afl/fl and Foxd1Cre/+ Hif2afl/fl mice. n = 10 per group per time point. (C and D) Expression of renal Hif2a, Hif1a, and Epo and plasma EPO levels in 8-week-old adult mice. (E–G) Hematocrit, renal Epo expression, and plasma EPO levels in 8-week-old adult mice with and without phlebotomy. Student’s t test and 1-way ANOVA were used for analyses of data in B–D and E–G, respectively. *P < 0.05, †P < 0.01, ‡P < 0.001.

