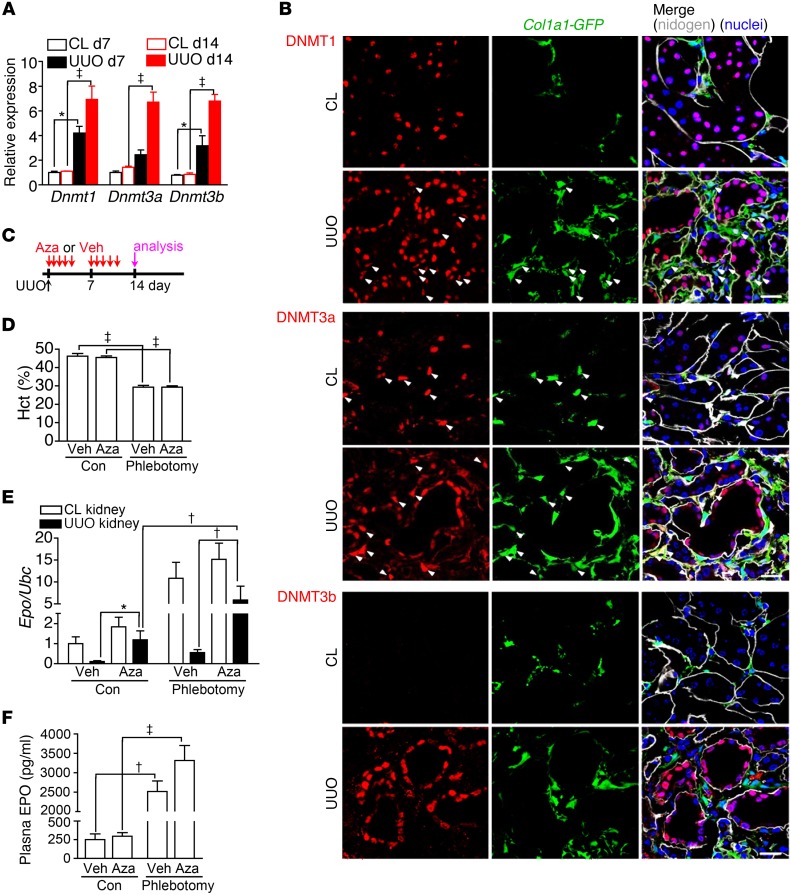
Figure 6. Aza restores EPO expression in fibrotic kidneys induced by UUO.
(A) Expression of Dnmt isoforms in CL and UUO kidneys after surgery. n = 10 per group. (B) Confocal images of DNMT1, DNMT3a, DNMT3b, and nidogen staining on kidney sections of Col1a1-GFPTg mice. Arrowheads highlight Col1a1-GFP+DNMT1+ or Col1a1-GFP+DNMT3a+ cells. Original magnification, ×400. Scale bar: 20 μm. (C) Schema illustrating Aza or Veh treatment in mice after UUO surgery. Phlebotomy was or was not performed 1 day before analyses at day 14 after UUO surgery. n = 10 per group. (D–F) Hematocrit, renal Epo expression, and plasma EPO levels in mice after UUO surgery and treatment with Veh or Aza according to the schema in C. One-way ANOVA was used for data analyses. *P < 0.05, †P < 0.01, ‡P < 0.001.

