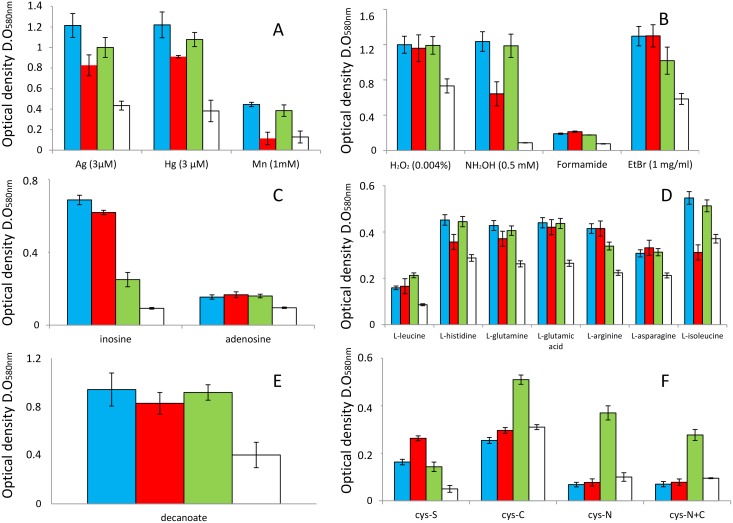
Fig 1. Phenotypical array characterization of clinical strains.
Graphics show the growth of the studied P. putida clinical strains and KT2440 in the presence of heavy metals (A); oxidative and other stressors (B); DNA intermediates as the only nitrogen source (C); amino acids (D) or fatty acid (E) as the only carbon source; and cysteine (cys) as the only sulfur (S), nitrogen (N), carbon (C) or carbon+nitrogen source (C+N). Blue bars, HB13667; red bars, H8234; green bars, HB3267 and white bars, KT2440. Error bars indicate standard deviation from three experimental repetitions. In parentheses concentration of stressor used, if concentration is not indicated means this was 5 mM. HB4184 was not included in this study because it forms lumps and thick biofilms in these culture conditions.

