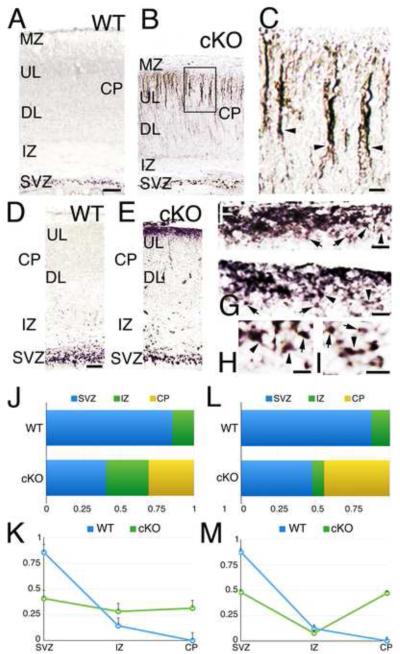
Figure 5. Tbr2-positive cells are ectopically located in the upper layers of the developing cortex in MDGA1 cKO mice.
A-I: Shown are coronal sections of the cortex from P0 (A-C) and E16.5 (D-I). WT and cKO immunostaining for Tbr2 reveals an ectopic population of Tbr2+ cells in the upper layers (UL) of the cKO cortex. A-C: At P0, Tbr2+ cells in WT cortex are limited to the SVZ (SVZ: 0.877±0.03; IZ: 0.122±0.06); whereas in cKO cortex, they are present in the SVZ (SVZ: 0.472±0.01, p=0.0048***; IZ: 0.076±0.007, p=0.05) and a substantial number of Tbr2+ cells are ectopically positioned in the upper layers of the cortical plate (CP, 0.472±0, p=0.0095***). Tbr2 protein is normally localized to the nucleus, as it is in basal progenitors of the SVZ in both WT and cKO cortex (A, B); but at P0 in the cKO (B, C), the ectopic Tbr2+ cells (arrowheads in C, which is a higher power of the boxed area in B) have aberrant Tbr2 protein localization to the apical process and a thin rim of cytoplasm surrounding the nucleus. D-I: At E16.5, Tbr2+ cells in WT cortex (D) are largely limited to the SVZ (SVZ: 0.856±0.02; IZ: 0.144±0.03). In cKO cortex (E), Tbr2+ cells are present in the SVZ (SVZ: 0.408±0.06, p=0.0008***; IZ: 0.282±0.05, p=0.1721), and a substantial number of Tbr2+ cells are ectopically positioned at the top of the CP (0.314±0, p=0.0029***). Tbr2 protein shows a variable localization (F-I), from being preferentially in the nucleus (arrows in F-I) to throughout the cell including multiple short processes extending from the cell body (arrowheads in F and G, and in the higher power panels H and I). J-M: quantification for Tbr2+ cells at E16.5 (J-K) and P0 (L-M) shows that the overall amount of Tbr2+ cells is not changed (P0: 1±0.01, p=0.8075; E16: 1±0.02, p=0.4051, J, L) but the laminar distribution is severely altered in the cKO (J-M). Tbr2+ cells in the SVZ are reduced in the cKO by 46% (E16.5) and by 55% (P0); whereas the CP, which does not express Tbr2 in WT, represents a 31% (E16.5) and a 46% (P0) of the Tbr2+ cells in the cKO. Abbreviation: DL: deeper layers; IZ: intermediate zone; MZ: marginal zone. Scale bars: A-B (100 μm), C (20 μm), D-E (100 μm) and F-I (20 μm).

