
Figure 14.
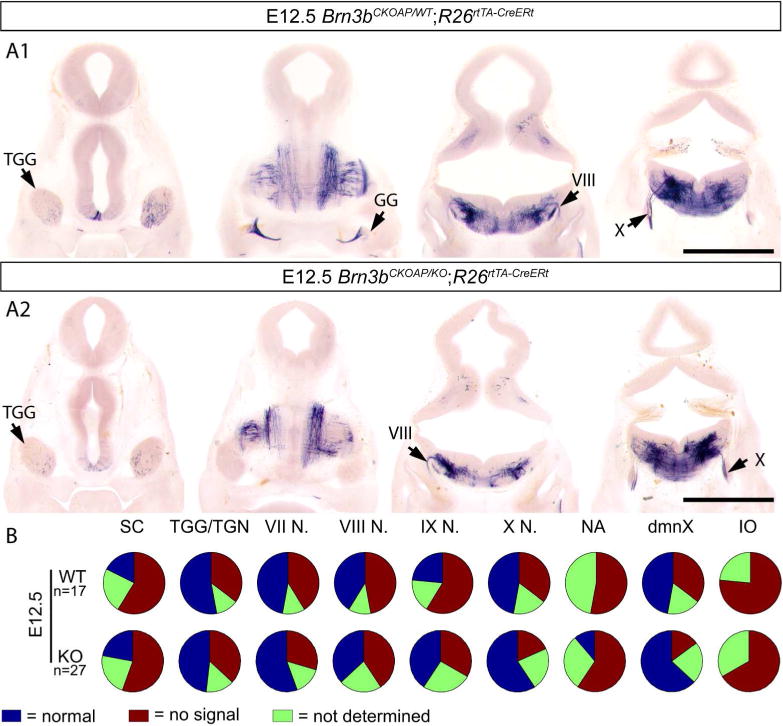
Analysis of Brn3bAP positive structures in E12.5 R26rtTA-CreERt; Brn3bCKOAP/WT (A1) R26rtTA-CreERt; Brn3bCKOAP/KO (A2). B, n = the total number of analyzed embryos per condition. Scale bars A1, A2= 1mm
Official websites use .gov
A
.gov website belongs to an official
government organization in the United States.
Secure .gov websites use HTTPS
A lock (
) or https:// means you've safely
connected to the .gov website. Share sensitive
information only on official, secure websites.
Analysis of Brn3bAP positive structures in E12.5 R26rtTA-CreERt; Brn3bCKOAP/WT (A1) R26rtTA-CreERt; Brn3bCKOAP/KO (A2). B, n = the total number of analyzed embryos per condition. Scale bars A1, A2= 1mm