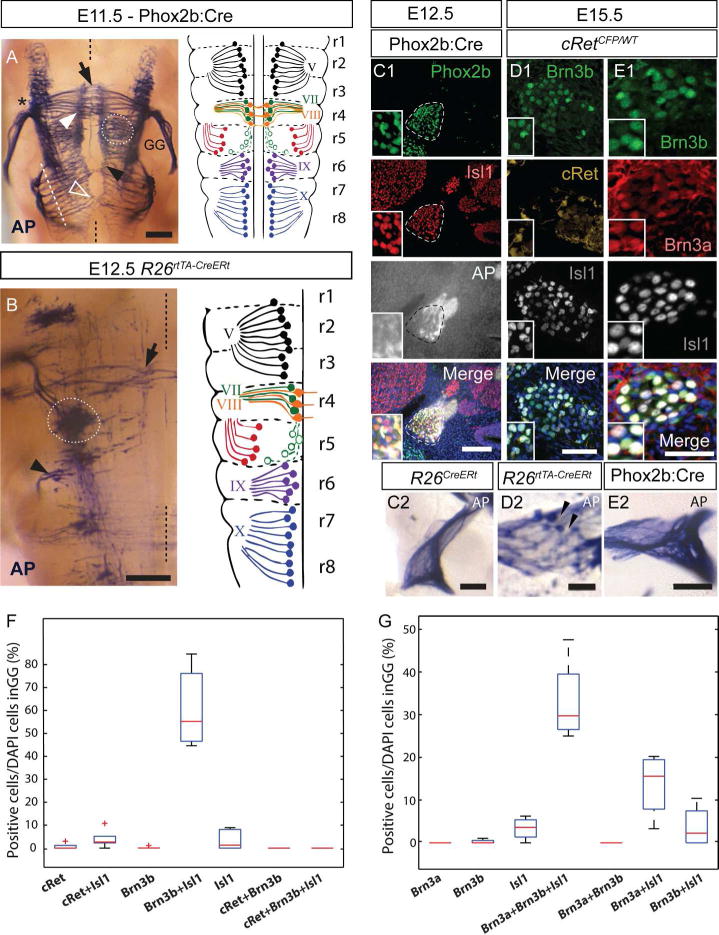
Figure 7. Brn3b expression in the developing facial nerve (VII) system.

A, Left panel, Brn3bAP histochemistry of the E11.5 brainstem of Phox2b:Cre; Brn3bCKOAP embryo in whole mount dorsal perspective. AP Positive cell bodies include visceral motor neurons of the superior salivatory nucleus (SSN) (white stippled circle) and branchiomotor neurons (white arrow head). Inner ear efferent fibers (black arrow) are crossing the midline (black stippled line). Exit point of the nerves VII and VIII are indicated by black asterisk. Cell bodies of the glossopharyngeal (black arrow head) and vagal (white hollow arrow) nuclei exiting the neuraxis through multiple rootlets, arranged in a continuous fashion (white stippled line). Right panel, schematic of the rhombomeric distribution of neuronal cell bodies, axonal processes and exit points of cranial nerves V, VII, VIII, IX and X, as they map onto the rhombomeres (adapted from Lumsden and Krumlauf, 1996). B, Whole mount Brn3bAP histochemistry same perspective as A, in an E12.5 R26rtTA-CreER; Brn3bCKOAP embryo. Left side of the animal, with the midline indicated by a black stippled line. Isolated cell bodies or small groups of the nuclei indicated in A and their axonal projections are visible. Black arrow indicates inner ear efferent neuron axons extending contralaterally across the midline. Superior salivary nucleus (white stippled circle). Group of cells with axons projecting in the glosspharyngeal nerve (black arrow head). C1, Combined Brn3bAP histochemistry and IIF of the GG (stippled lines) in the Phox2b:Cre; Brn3bCKOAP E12.5 embryo, showing extensive Phox2b and Isl1 double positive neurons in the GG. C2 Coronal section at the level of the GG of the R26CreERt; Brn3bCKOAP E12.5 mouse, with no visible AP positive cell bodies. D1,E1 Immunostaining of the GG in cRetCFP/WT E15.5 embryos. D2, Coronal section at the level of the GG of the R26rtTA-CreERt; Brn3bCKOAP E15.5 embryo, showing Brn3bAP positive cells (black arrowheads). E2 AP positive fibers crossing the GG of Phox2b:Cre; Brn3bCKOAP E15.5 embryo with no visible AP positive cell bodies. F box whisker plots for cell populations in D1. G box whisker plots for cell populations in E1. Scale bars: A = 250μm, B = 200μm, C1,C2, D1, D2, E2 = 100μm, E1=50μm
