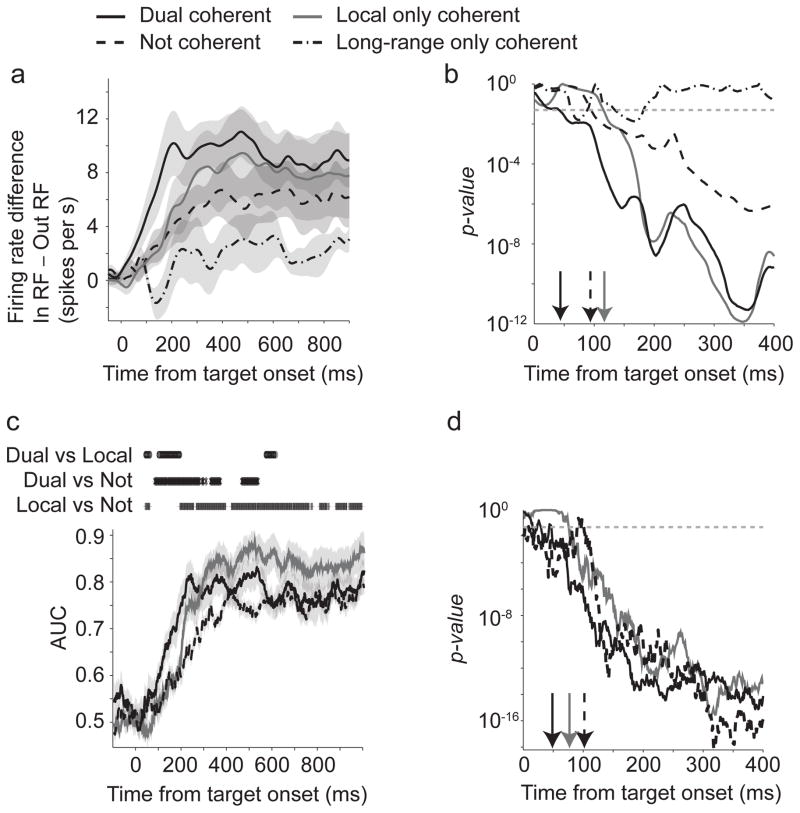
Figure 3.
a) Difference in firing rate for movements into and out of the RF for different groups of neurons. Mean ± S.E.M. are shown. b) P-values for a Wilcoxon rank sum test comparing firing rates into and out of the RF for each group. Arrows indicate the first point the statistical tests fell below 0.05 for three consecutive bins and remained significant. c) Area under the curve values for a ROC analysis on population average firing rates for movements into and out of the RF. Mean ± 95% confidence intervals are shown. The symbols above the AUC lines indicate significant differences between each pair of lines using a FDR corrected Wilcoxon rank sum test. d) P-values for a Wilcoxon rank sum test comparing the AUC values for each group against 0.5. Arrows indicate the first point the statistical tests fell below 0.05 for three consecutive bins and remained significant.

