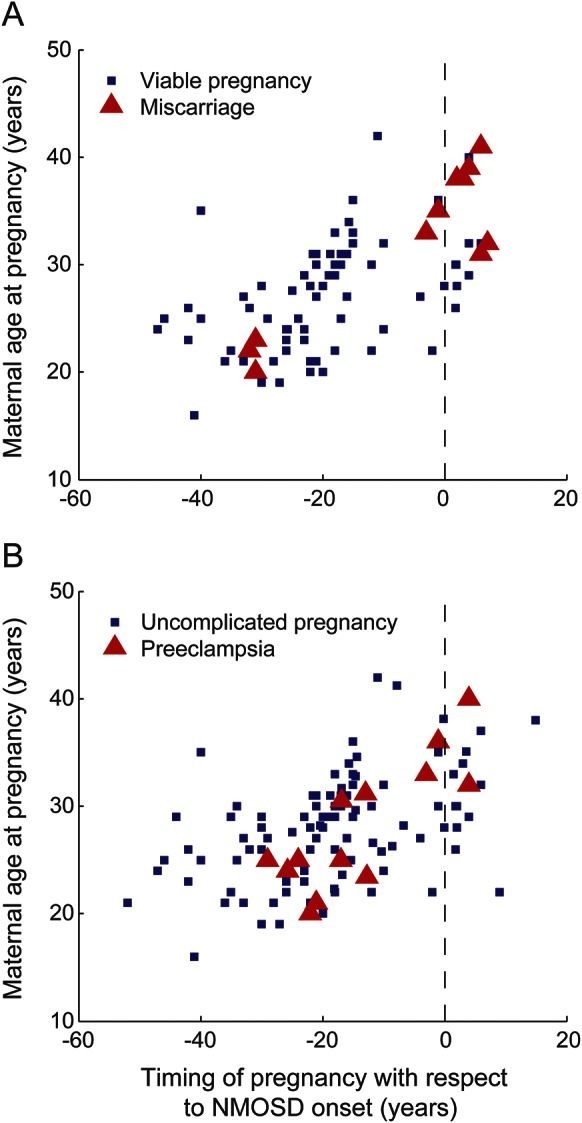
Figure 1. Relationships between adverse pregnancy outcome, NMOSD onset, and maternal age.

(A) Distribution of pregnancies ending in miscarriage, plotted against maternal age and pregnancy timing with respect to NMOSD onset. Blue squares denote viable pregnancies at time of delivery. Red triangles denote pregnancies ending in miscarriage, at time of miscarriage. Black vertical line marks onset of NMOSD. (B) Distribution of pregnancies complicated by preeclampsia, plotted against maternal age and pregnancy timing with respect to NMOSD onset. Blue squares denote viable pregnancies without preeclampsia, at time of delivery. Red triangles denote viable pregnancies complicated by preeclampsia, at time of delivery. Black vertical line marks onset of NMOSD. NMOSD = neuromyelitis optica spectrum disorder.
