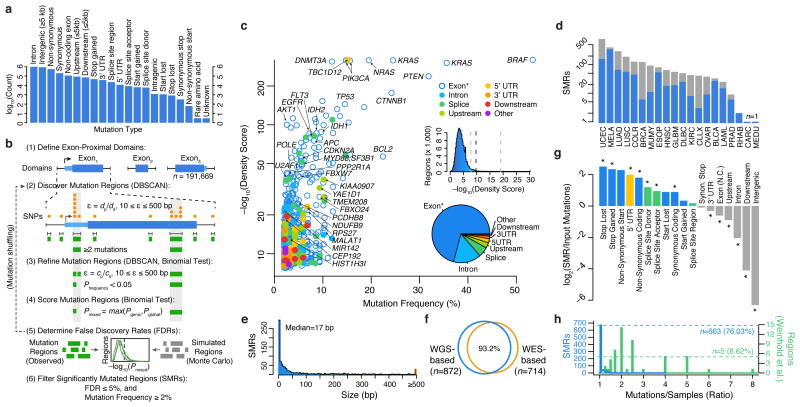
Figure 1.
Identification of significantly mutated regions (SMRs) in 20 cancer types across a broad spectrum of functional elements. (a) Pan-cancer distribution of mutation types in n=3,078,482 somatic single-nucleotide variant (SNV) calls. (b) Exons and exon-proximal domains (±1,000 bp) were scanned for clusters of somatic mutations (orange, DBSCAN). Distance parameter ε is dynamically defined as the average distance of mutated positions (dp) in the domain size (ds). Clusters (green) are divided if sub-clusters with higher mutation densities (P < 0.05, binomial test) are found in a second-pass analysis with ε defined as the average distance of mutated positions (cp) within the cluster of size cs (see Online Methods for density scoring and FDR calculation). (c) Per-cancer mutation frequency and density scores of discovered SMRs (color-coded by type and labelled by associated gene). The distribution of density scores in evaluated regions and SMR region types are shown in insets (middle) and (bottom), respectively. Dashed lines indicate the minimum, median, and maximum density score FDR (5%) thresholds. “Exon*” label refers to coding exons and non-coding genes. (d) Number of SMRs with FDR ≤ 5% and mutation frequency ≥2% per cancer type. Gray bars indicate SMRs with FDR ≤ 5% but mutation frequency <2%. (e) SMR size distribution. (f) Concordance between SMRs discovered by employing background models derived from whole-genome (WGS-based) or whole-exome (WES-based) sequencing. (g) Categories with significant fold change in mutation type representation between SMR-associated and input mutations are denoted (*; P < 0.01). (h) Distribution of the number of mutations per sample in SMRs (blue) and 58 (green) recurrently-altered non-coding regions20.

