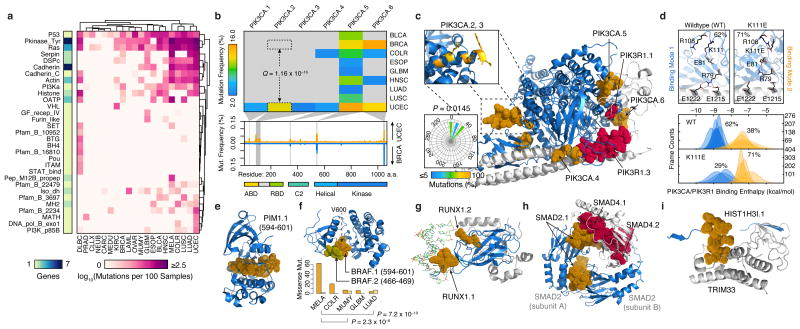
Figure 3.
Structural mapping of SMRs onto proteins and complexes reveals differentially-altered regions among cancers and molecular interfaces targeted by recurrent alterations. (a) Non-synonymous mutation frequency per PFAM protein domain, per cancer, per residue. Number of genes per domain is shown (left). (b) Mutation frequency matrix of PIK3CA SMRs across cancer types, and comparison of per residue mutation frequency of PIK3CA domains46 in endometrial (UCEC; orange) and breast cancer (BRCA; blue) samples. Gray bars indicate SMRs within PIK3CA. (c) Co-crystal structure of the PIK3CA (p110α; blue) and PIK3R1 (p85α; gray) interaction (PDB: 2RDO, 2IUG, 3HIZ). Residues within endometrial cancer SMRs on PIK3CA (orange) and PIK3R1 (red) are rendered as solvent-accessible surfaces. Insets display mutated residues within the PIK3CA.2, PIK3CA.3 SMR α-helix (yellow, top) and their corresponding side-chain dihedral angles (bottom). (d) Molecular dynamics simulations suggest PIK3CA–PIK3R1 binding is bimodal (bottom). Mutations within the PIK3CA.2, PIK3CA.3 SMR α-helix interfere with R79 binding contacts at the PIK3R1 interface, as shown in the wildtype and K111E mutant. Molecular structures of spatially-clustered (e) mutations (diffuse large B-cell lymphoma) and (f) SMRs (multiple myeloma), (g) a DNA (green) interface SMR, (h) reciprocal protein interface SMRs, and (i) a histone H3.1 SMR in the TRIM33 interface. Structural alignments and molecular visualizations prepared with PyMOL (Schrödinger). The relative proportions of BRAF.1 and BRAF.2 missense mutations per cancer type are shown in (f). PDB codes for (e-i) are 3CXW, 1UWH, 1H9D, 1U7V, and 3U5N, respectively.

