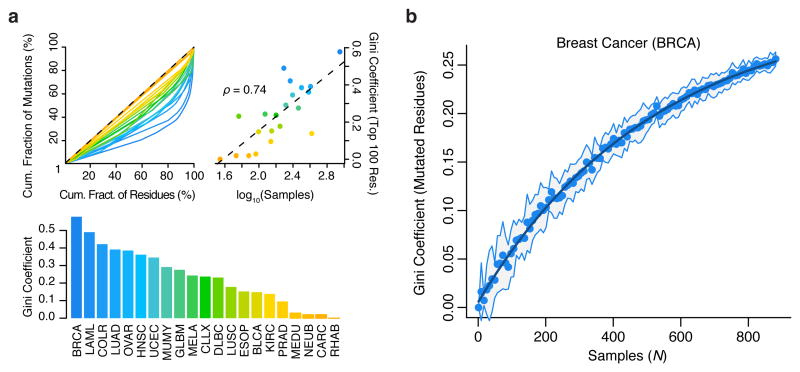
Figure 5.
Structure in the distribution of cancer mutations remains largely uncharacterized. Gini coefficients of dispersion were calculated as the fraction of non-synonymous mutations contained per residue, across ∼19,000 proteins. (a) Lorenz curves (top-left), Gini-coefficients (top-right), and their correlation with tumor sample numbers (bottom) are shown. (b) Gini coefficients of non-synonymous mutation frequency in breast cancer as a function of (bootstrapped) sample size. Line of exponential fit is shown in dark blue. For comparisons between cancer types (a), the Gini coefficients were computed exclusively on the 100 most mutated residues per cancer.

