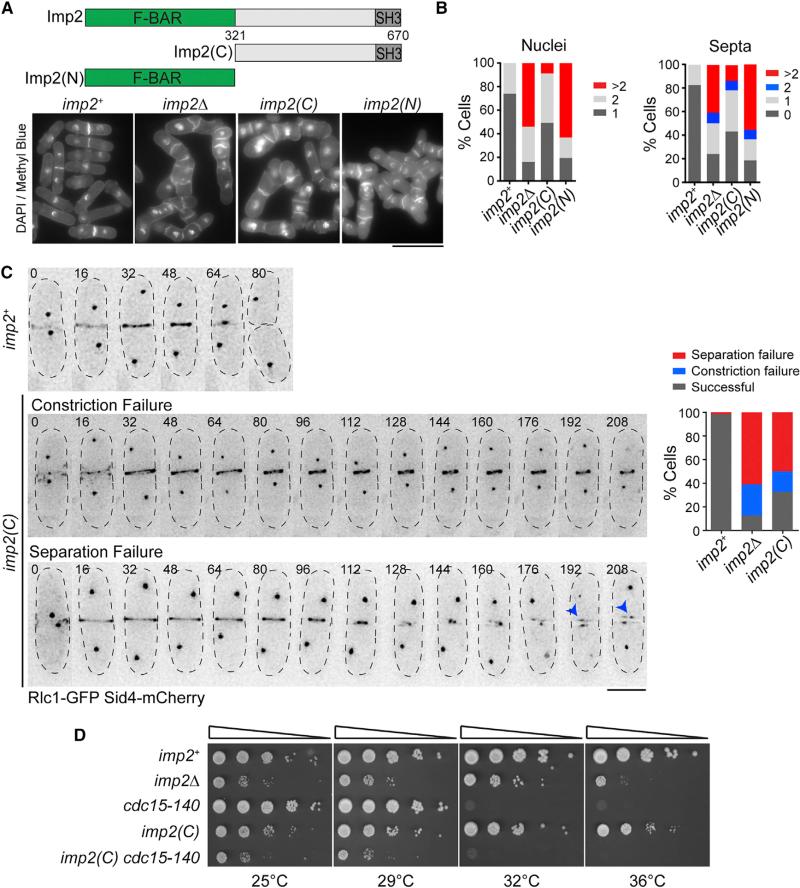
Figure 1. The Imp2 F-BAR Domain Is Important for Cytokinesis.
(A) Schematic of Imp2 and truncation alleles Imp2(C) and Imp2(N). Bottom: DAPI- and methyl blue-stained cells of the indicated imp2 genotype. Scale bar, 10 μm.
(B) Cytokinesis phenotype quantifications of cells in (A); n ≥ 300 for each strain.
(C) Representative images (left) and quantification (right) of cytokinesis defects in imp2+, imp2Δ, and imp2(C); n > 30 for each strain. Blue arrowheads indicate persistent contractile ring remnants. Numbers indicate time (min) from spindle pole body duplication. Scale bar, 5 μm.
(D) Serial dilutions of imp2 strains at the indicated temperatures.
See also Figure S1.

