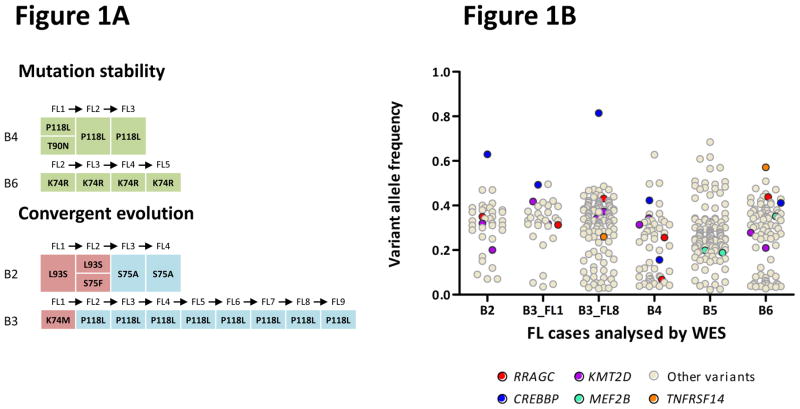
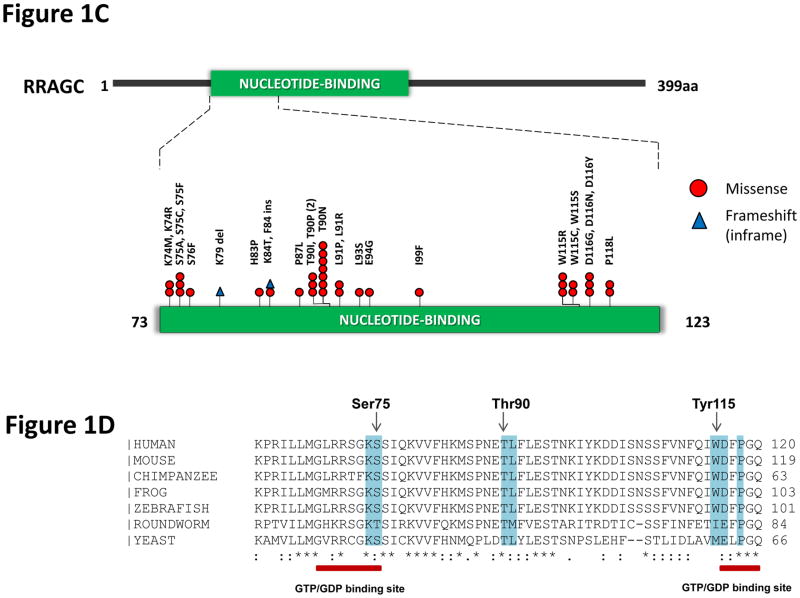
Figure 1.
Identification of frequent RRAGC mutations in FL. (a) RRAGC mutations show two different patterns of conservation in successive tumor biopsies during FL progression in the discovery WES cases: mutation stability and convergent evolution. (b) Variant allele frequency (VAF) distribution and density for all the non-synonymous mutations identified in the 5 WES cases. In each case, the first available biopsy is depicted, with the exception of B3 where two time points are illustrated (B3_FL1 and B3_FL8). (c) Schema of the protein domain and locations of the RRAGC mutations identified in this study (NCBI protein reference sequence: NP_071440.1). Thirty-seven mutations affecting 32 cases. ‘^’ denotes a second RRAGC mutation occurring in a different disease event from the same patient. ‘*’ represents a second RRAGC mutation within the same biopsy of a particular patient. Multiple circles for the same amino acid represent multiple cases with mutations affecting the same residue. (d) Sequence alignment of a section of the RRAGC nucleotide binding domain. Conserved residues across all the listed species is indicated by an asterisk (*). The location of the GTP/GDP binding sites are indicated by the red horizontal bar (locations: aa 68–75; and aa 116–120) whilst the recurrent hotspot residues are highlighted by the light blue vertical panel.


