Abstract
In order to better understand the mechanics of the heart and its disorders, engineers increasingly make use of the finite element method (FEM) to investigate healthy and diseased cardiac tissue. However, FEM is only as good as the underlying constitutive model, which remains a major challenge to the biomechanics community. In this study, a recently developed structurally based constitutive model was implemented to model healthy left ventricular myocardium during passive diastolic filling. This model takes into account the orthotropic response of the heart under loading. In-vivo strains were measured from magnetic resonance images (MRI) of porcine hearts, along with synchronous catheterization pressure data, and used for parameter identification of the passive constitutive model. Optimization was performed by minimizing the difference between MRI measured and FE predicted strains and cavity volumes. A similar approach was followed for the parameter identification of a widely used phenomenological constitutive law, which is based on a transversely isotropic material response. Results indicate that the parameter identification with the structurally based constitutive law is more sensitive to the assigned fiber architecture and the fit between the measured and predicted strains is improved with more realistic sheet angles. In addition, the structurally based model is capable of generating a more physiological End-Diastolic Pressure-Volume Relationship in the ventricle.
Keywords: Constitutive Modeling, Finite Element Method, Left Ventricle, MRI, Optimization
Introduction
Understanding the complex structure of myocardium has been the subject of many studies. For example, several investigations were conducted to develop imaging techniques to obtain quantitative information about the 3D architecture of the myofiber and collagen network in ventricular myocardium.36,25 Accordingly, different models of cardiac structure have been proposed to better understand its performance. In particular, Gilbert et al.7 compared seven different models that are used to describe the architecture of the heart. A common approach in the engineering community is to consider the myocardium as layered sheets of myofibers, which have orientation angles that vary transmurally and depend on species. Some of the first quantitative measurements of myofiber orientations were collected from canine ventricles.28 Subsequent investigations showed that myocardial microstructure is composed of discrete layers which run transmurally across the ventricular wall.27,9 LeGrice et al. provided a more detailed and systematic account of the architecture of these sheets.21
After obtaining descriptions of the geometry and structure of the myocardium, the next step in understanding myocardial mechanics is the constitutive equations that characterize the material properties of myocardium. There are several proposed models for describing the elasticity of myocardium, which are generally classified as: isotropic, transversely isotropic and orthotropic models. Isotropic models are not appropriate in view of the morphology and structure of passive myocardium.12 Most of the previous analyses of cardiac function were based on the assumption that the material properties of the heart are highly dependent on muscle fiber orientation, but independent of the direction in the plane transverse to the muscle fiber axis.16 This is to say that the material properties of myocardium are symmetric about the myofiber axis, which is referred to as transversely isotropic. Several constitutive models have been developed, which assume the myocardium is a transversely isotropic material,14,13,3,17 Of particular interest to the current study is the model by Guccione et al.10, which we will refer to as the Guccione model. While transversely isotropic models are based on biaxial tension tests of myocardium, the results from shear experiments have showed that the resistance of myocardial tissue to simple shear loading in different planes is noticeably different. This suggests that myocardial tissue in diastole is an orthotropic material with distinct material properties in orthonormal planes of symmetry.4
Although transversely isotropic models have been used extensively in computational simulations of myocardium, which have led to great insights to the mechanics of the heart, they do not capture the distinct response of myocardium in the three mutually orthogonal planes. Therefore more recently, orthotropic models of passive myocardium have been proposed, which take into account for the distinct material response in the mutually orthogonal planes. The pole-zero model15 and the modified Fung type models presented in3,26 are among some of the proposed orthotropic models, which can account for differences in material response with respect to multiple planes. These models are partly structurally based (relating the fiber, sheet, and normal directions) and are partly phenomenological, since they are based on biaxial data rather than shear data.12
The most recent orthotropic model for passive myocardium was proposed by Holzapfel and Ogden.12 We will refer to this as the H-O model. Holzapfel and Ogden treated the left ventricular myocardium as a non-homogeneous, thick-walled, nonlinearly elastic, and incompressible material. This model takes into account the muscle fiber, myocyte sheet, and sheet normal directions. Additionally, this model describes the general characteristics of the available biaxial and shear experimental data, as examined in detail in their study. The H-O model is invariant based and well suited for use within the finite element (FE) method.11 Furthermore, it is consistent with standard inequalities required for considerations of convexity, strong ellipticity, and material stability.12
The H-O model has been implemented in order to perform a finite element analysis of a generic biventricular heart model subjected to physiological ventricular pressure.8 Wang et al.32 made use of the H-O model in a finite element simulation of a human left ventricle (LV), where the geometry was determined from magnetic resonance imaging (MRI) data. Additionally, they investigated the sensitivity of the H-O model to parameterizing errors and compared the results with other constitutive models and experimental results from canine hearts. In a follow up study, a modified H-O model was introduced, which takes into account the effect of residual stresses in the myocardium.31 In both of these studies, the material parameters that were used in the ventricular finite element simulations were obtained by fitting the H-O model to previously published simple shear test data from porcine myocardium.4 Holzapfel and Ogden12 also reported a set of material parameters by fitting their model to this experimental data.
Other studies have also used the same set of material parameters to implement the H-O model in their simulations. For example, Baillargeon et al.2 used the parameters of Goktepe et al.8 to implement the H-O model in order to represent a proof-of-concept simulator for a four-chamber human heart model created from computed tomography and MRI. Some studies have used modified forms of the H-O model that have less material parameters. In a sense, these models have made limited use of the structurally based constitutive model by using less material parameters from the original form. For example, Krishnamurthy et al.19 used a transversely isotropic variation of the H-O model, which has only four material parameters, to build LV models. That study incorporated myofiber and sheet architecture obtained from diffusion tensor MRI of an isolated and fixed human organ-donor heart, and then transformed it to a patient specific geometric model.
Most recently, Gao et al.5 investigated the feasibility of identifying parameters of the H-O model from non-invasive clinical measurements for healthy myocardium. They introduced an optimization scheme to first identify known parameters of a LV model by generating a set of synthetic strain data and then extended their optimization method to in-vivo models with clinical data. In this study in-vivo strain data from cine MRI, along with a set of population based pressure data rather than measured pressure, were used to identify material parameters.
To our knowledge, parameter identification of the H-O material law using animal-specific strain data from SPAMM (SPAtial Modulation of Magnetization) MRI and synchronous pressure catheterization data has not yet been implemented. In this study we make use of finite element models, which employ the H-O material law, and the optimization scheme proposed by Gao et al.5 to estimate the eight material parameters of the H-O model using in-vivo MRI and pressure data from four healthy porcine LVs. Additionally, the resulting End-Diastolic Pressure-Volume Relationship (EDPVR) of each LV is examined to further explore the influence of the H-O model. Finally, the results obtained from the H-O models are compared with finite element models that employed the widely used Guccione constitutive model, which were also determined by optimization. The long-term goal of this work is to develop techniques that can be used to build validated patient-specific models of the heart in order to improve the diagnosis and treatment of heart disease.
Materials and Methods
Animal model and MRI acquisition
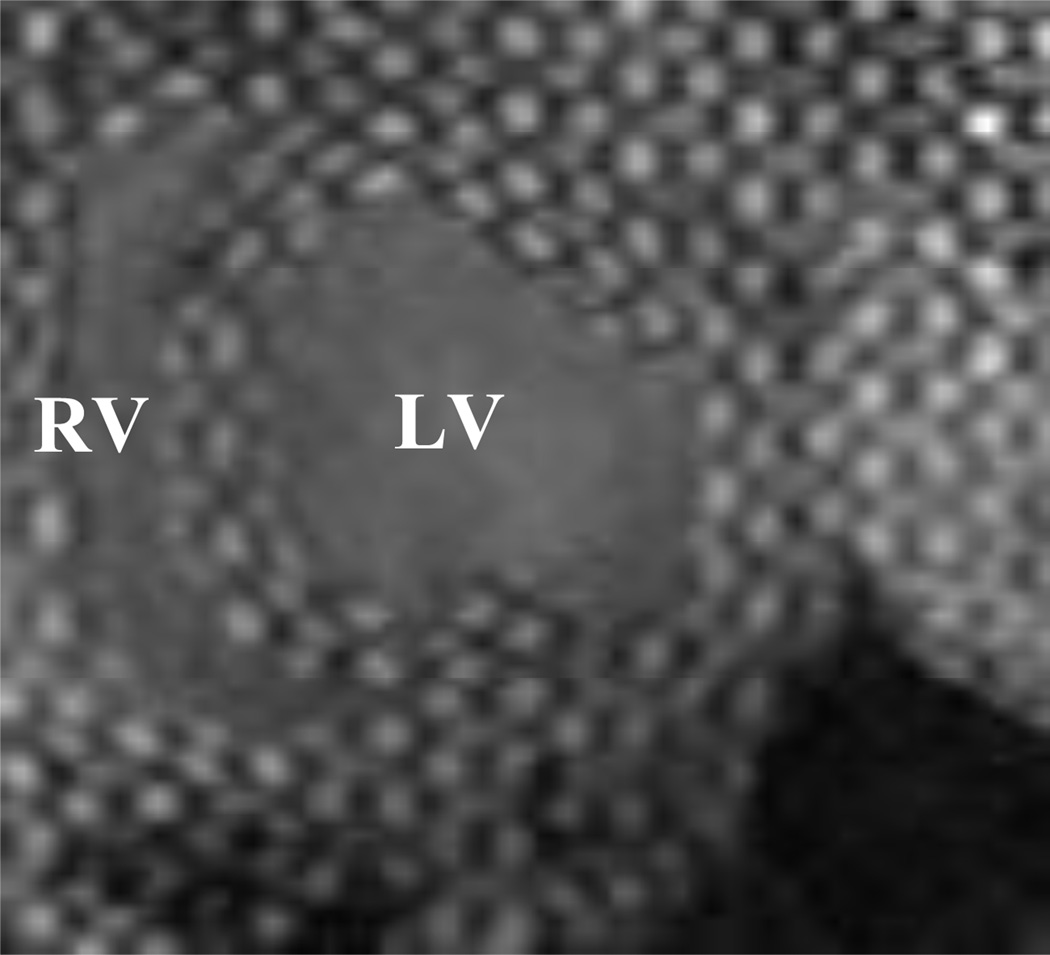
The data used in the current study is from same animal cohort that was used in the study of Mojsejenko et al.22 The animals used in this work received care in compliance with the protocols approved by the Institutional Animal Care and Use Committee at the University of Pennsylvania in accordance with the guidelines for humane care (National Institutes of Health Publication 85–23, revised 1996). Detail regarding the MRI sequence parameters and optical flow technique used to calculate the experimental strains can be found in.22, 35 Briefly, 3D SPAMM MRI (Fig. 1) was performed in order to assess regional wall deformation in four healthy adult male pigs weighing approximately 40 kg. The endocardium and epicardium of the LV were contoured from the 3D SPAMM images. The reference contours were generated at early-diastolic filling and the endocardium was also contoured at end-diastole in order to calculate LV volume. Diastolic strain was calculated from the 3D SPAMM images using a custom optical flow plug-in for ImageJ to derive 3D displacement flow fields.35 The LV strain, volume, and contour data were all generated from the 3D SPAMM images and matched with the simultaneous pressure measurements. This ensures that the data used in this study is consistent in terms of space and time.
Figure 1.
Short axis view of 3D SPAMM images from case 1 at end-diastole.
Finite Element Model
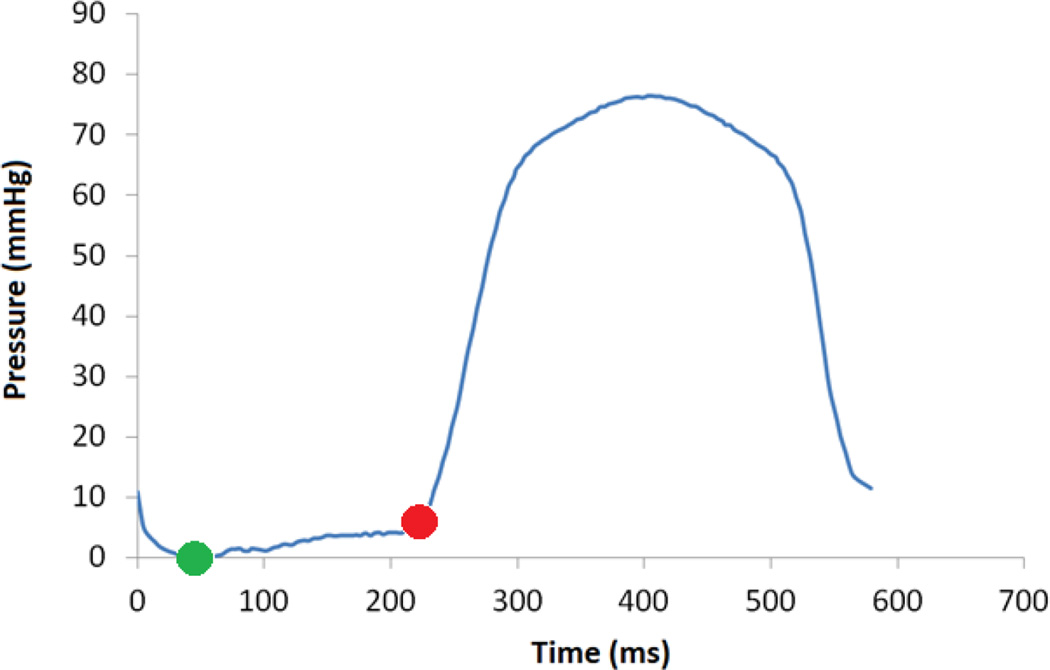
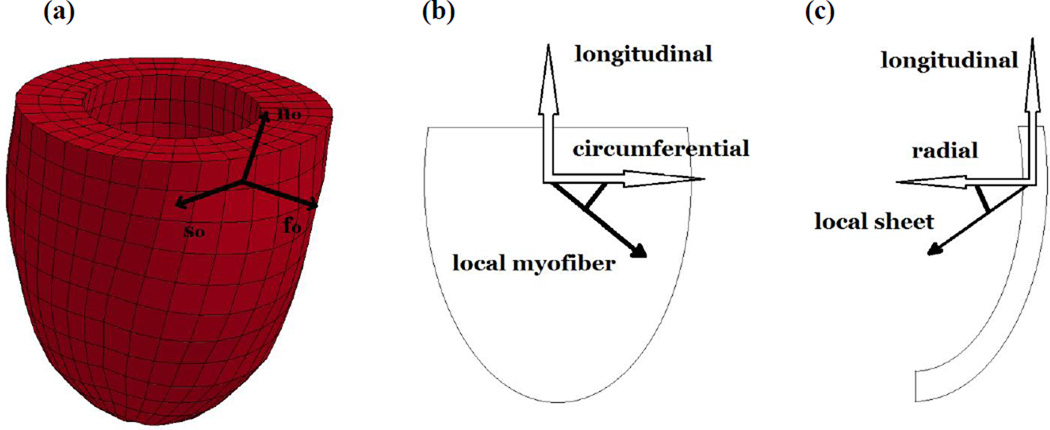
The finite element model generation procedure is also explained in detail previously.22 The primary difference between the previous study and the current study is the focus on healthy left ventricular myocardium and the use of the H-O model, whereas the previous study evaluated infarcted myocardium with the Guccione model. Briefly, the unloaded reference configuration of the FE model was taken to be early diastole since it represents a relatively stress-free state as a result of minimal LV pressure. The endocardial wall of the LV model was loaded with a pressure boundary condition, which was increased from zero to the end-diastolic value taken from the animal-specific pressure catheter measurements (Fig 2). FE models were generated by fitting the endocardial and epicardial contours derived from MRI with 3D surfaces (Rapidform; INUS Technology, Inc., Sunnyvale, CA). Hexahedral trilinear elements (TrueGrid; XYZ Scientific, Inc., Livermore, CA, USA) were used to generate the finite element mesh of the myocardium (Fig. 3a). After performing a mesh convergence study, the wall of each FE model consisted of approximately 1500 elements. A transmural thickness of three elements deep was found to be sufficient for accurate calculations while maintaining computational efficiency. A custom MATLAB code was used to assign a linear distribution of myofiber orientation and myocyte sheet angles to each hexahedral element (Fig3b and 3c). For myofiber orientation angles, a distribution of −37° (at epicardium) to +83° (at endocardium) with respect to the circumferential direction was used based on the study of Lee et al.20, which evaluated porcine myocardium. The myocyte sheet angles varied from −45° (at epicardium) to +45° (at endocardium) with respect to radial direction following LeGrice et al.21 A homogeneous distribution of the fiber and sheet angles was assumed over the entire LV. The constitutive models outlined in the next section were coded as user defined material subroutines that were implemented in the nonlinear FE solver LS-DYNA (Livermore Software Technology Corporation, Livermore, CA). An explicit time integration scheme is employed, which is based on the central difference method and is second-order accurate in time. An adaptive time stepping method, which is based on the sub-cycling technique, is used to guarantee solution stability throughout each simulation.
Figure 2.
Pressure versus time collected from LV catheterization of case 1. The green point indicates early-diastolic state, which was used as the unloaded reference configuration, and the red point indicates the end-diastolic time point that was used to load the model.
Figure 3.
(a) Finite Element model of porcine LV for case 1, the frame shows local fiber (f0), sheet (s0) and normal (n0) directions used in the H-O model. (b) Example of a negatively oriented myofiber direction, relative to the circumferential direction. (c) Example of a negatively oriented sheet direction, relative to the radial direction.
Constitutive Model
The strain energy function per unit reference volume proposed for the H-O model is given by12:
| (1) |
where a, b, af, bf, as, bs, afs and bfs are the eight positive material constants (a parameters have dimensions of stress while b parameters are dimensionless). The contribution of isotropic terms is included in I1, transversely isotropic terms in I4f, I4s and orthotropic terms in I8fs.
The four invariants used in the strain energy function are defined as follows:
| (2) |
where f0 and s0 are unit vectors that define the myofiber direction and myocyte sheet direction, respectively (Fig. 3), and C is the right Cauchy-Green deformation tensor defined as:
| (3) |
where F is the deformation gradient tensor.
In order to avoid numerical complications in the finite element analysis of myocardium, which is assumed to be a nearly incompressible or slightly compressible material, the concept of multiplicative decomposition of the deformation gradient tensor F is used. Consequently, the strain energy function and second Piola-Kirchohff stress tensor were also decomposed into volumetric (volume-changing) and isochoric (volume preserving) parts11:
| (4) |
| (5) |
where J = det (F) and the tensors F̄ and C̄ are the modified deformation gradient and modified right Cauchy-Green tensors, respectively. In the same way, modified invariants (shown with over bar) can be defined using C̄ instead of C in their original definition.
The unique decoupled representation of the strain energy function is defined in the form11:
| (6) |
or when the strain energy is written as a function of the invariants:
| (7) |
The first part of Eq. (7) is the purely volumetric contribution to ψ and in the case of incompressibility it denotes a Lagrange contribution and enforces the associated kinematical constraint.6 In the current computational implementation, the volumetric contribution is defined by:
| (8) |
where K is the bulk modulus and J is the jacobian of the deformation gradient tensor33. A penalty method was used to enforce the near incompressibility condition.
The second part of Eq. (7) is the purely isochoric contribution to ψ and its representation is the same as Eq. (1), but with the invariants replaced with their corresponding modified invariants. The second Piola-Kirchoff stress tensor is defined as the sum of the purely volumetric and purely isochoric parts:
| (9) |
Using the well-known relation we have:
| (10) |
| (11) |
The widely used transversely isotropic Guccione constitutive law10 was chosen to compare to the results of the H-O model.10 In this model, the Fung-type exponential relation of strain energy for passive myocardium is as follows:
| (12) |
with transverse isotropy given by:
| (13) |
where the constants C, bf, bt and bfs are material parameters, E11 is the Green-Lagrange strain in the fiber direction, E22 is the sheet normal strain, E33 is the strain in the sheet direction and the rest are shear strains. For this model again we make use of decoupling the strain energy function into volumetric and isochoric parts. The final form of the Second Piola-Kirchoff stress is derived by taking the derivative of the strain energy function with respect to the deformation:
| (14) |
where near incompressibility is also enforced with a penalty method and Dev is deviatoric projection operator:
| (15) |
The user defined material subroutine for the Guccione model was previously developed and implemented by Sun et al.29
Single Element Verification Test
In order to initially validate the implementation of the H-O model into our FE framework, the results of the simple shear experiments of Dokos et al.4 were replicated using the H-O model in a FE simulation of a single element. Previous independent studies have used this same shear data to estimate sets of the eight material parameters.12, 8, 32 Here we used the H-O parameters from Goktepe et al.8 to simulate the simple shear FE model. As in the previous studies, a maximum shear of 50% was imparted on the top surface of the element, while the bottom surface remained fixed.
Parameter Estimation Scheme Using In-Vivo LV Data
The multi-step optimization scheme proposed by Gao et al.5 was used to estimate the eight material parameters of the H-O model. Optimization was performed in three steps by minimizing the two following objective functions in a specific sequence:
| (16) |
| (17) |
where n is the strain point within the myocardium, N is the total number of strain points, Eij,n and V are the FE predicted end-diastolic strain and end-diastolic LV cavity volume, respectively, and the corresponding over bar variables represent in-vivo values. A total of N = 252 points in the mid-wall of the LV FE model, along with 252 of the nearest LV points measured from MRI data, were chosen for generation of each objective function. Details of the multi-step optimization scheme are presented in the study of Gao et al.5 Briefly, in the first step all of the parameters are updated by minimizing the objective function fo1 (Eq. (16)) in order to determine the two scaling factors Ca and Cb, which are defined as:
| (18) |
where agroup = {a, af, as, afs}, bgroup = {b, bf, bs, bfs} and are an initial set of available H-O parameters. In the current study, we chose the parameters fit by Wang et al.32 to simple shear tests of porcine heart samples as and (Table 1). The proposed objective function in this step is volume dominated in order to handle the difficulties caused by the correlation of the parameters.5 Since the volume term in is fo1 not normalized, it essentially acts as a weight factor, which is meant to increase the influence of the volume fitting during the optimization. This step is a rough estimation of the parameters based on the available H-O parameters which takes much less computational effort compared to the second and third steps. This is because the parameter space is merely swept over during the first step. In the second step, af and bf are optimized using fo2 as the objective function while enforcing the following two constraints:
| (19) |
Table 1.
Parameters of Wang et al.32 used as the intial set of parameters in step 1.
| a (kPa) | b | af (kPa) | bf | as (kPa) | bs | afs (kPa) | bfs |
|---|---|---|---|---|---|---|---|
| 0.2362 | 10.810 | 20.037 | 14.154 | 3.7245 | 5.1645 | 0.4108 | 11.300 |
The second step is the most computationally intensive step where four of the eight parameters are estimated more precisely by minimizing (fo2). Finally, in the third step, a and afs are updated by optimizing the scaling factor C3 defined as follows and using fo1 as the objective function.5
| (20) |
In this step, the objective function fo1 is used once more to ensure that the volume matching is still satisfied.
A single step optimization scheme using the objective function fo2 (Eq. (17)) was used to determine the four material parameters of the transversely isotropic Guccione model. To minimize the objective function in each step of the multi-step scheme and single step scheme, a Genetic Algorithm (GA) technique was chosen as the optimization method using LS-OPT software (Livermore Software Technology Corporation, Livermore, CA). Nair et al.23 have shown that GAs are robust for the optimization of cardiac material parameters in 3D models. Details of the genetic algorithm used in this study, along with a flow chart of the optimization procedure, are presented in the study of Mojsejenko et al.22 Briefly, for the multi-step scheme, the design variables are Ca and Cb in first step, af, as, bf and bs in second step, and C3 in third step. In the single step scheme the design variables are the four material parameters (C, bf, bt and bfs). Within each iteration of the optimization, the software LS-DYNA runs 100 FE simulations corresponding to each set of design variables, after which LS-OPT begins the optimization using Eq. (16) and Eq. (17) as objective functions. Each optimization was run on a single compute node (16 CPUs) and convergence was reached after less than 30 iterations which took around 20 hours of clock time.
In order to compare the optimization results of the two constitutive models more directly, the optimized parameters were used to run FE simulations corresponding to each of the four LV cases. Then, the mean squared error (MSE) between the FE predicted strains and MRI measured strains were computed using:
| (21) |
Generation of EDPVR curves
After running the optimization with data from the four porcine cases, the final optimized material parameters from both constitutive models were used to generate end-diastolic pressure-volume relationship (EDPVR) curves for each case. To do this, the FE model of the LV was loaded with different end-diastolic pressures above and below the measured end-diastolic pressure to obtain the corresponding end-diastolic volumes. The method proposed by Klotz et al.18, to estimate the EDPVR curve from a measured end-diastolic pressure and volume point, was used to generate a physiological benchmark for comparison with the FE predicted EDPVR curves. The Klotz relation for end-diastolic pressure in mmHg versus end-diastolic volume in mL is
| (22) |
where α and β are defined as
| (23) |
| (24) |
Vm and Pm are measured volume and pressure, respectively, V30 is the end-diastolic volume at an end-diastolic pressure of 30 mmHg, which is defined as
| (25) |
where An = 28.2, Bn = 2.79 and V0 is the unloaded LV cavity volume or end-diastolic volume at pressure of 0 mmHg. In this study, instead of using an empirical identity that Klotz et al. developed to estimate LV volume at zero pressure18, we used measured volume at early diastole, which is the closest to a zero pressure state as can be measured in-vivo. Additionally, the same value was used as the reference volume to build the FE models, which allows a more direct comparison to the Klotz et al. results.
Results
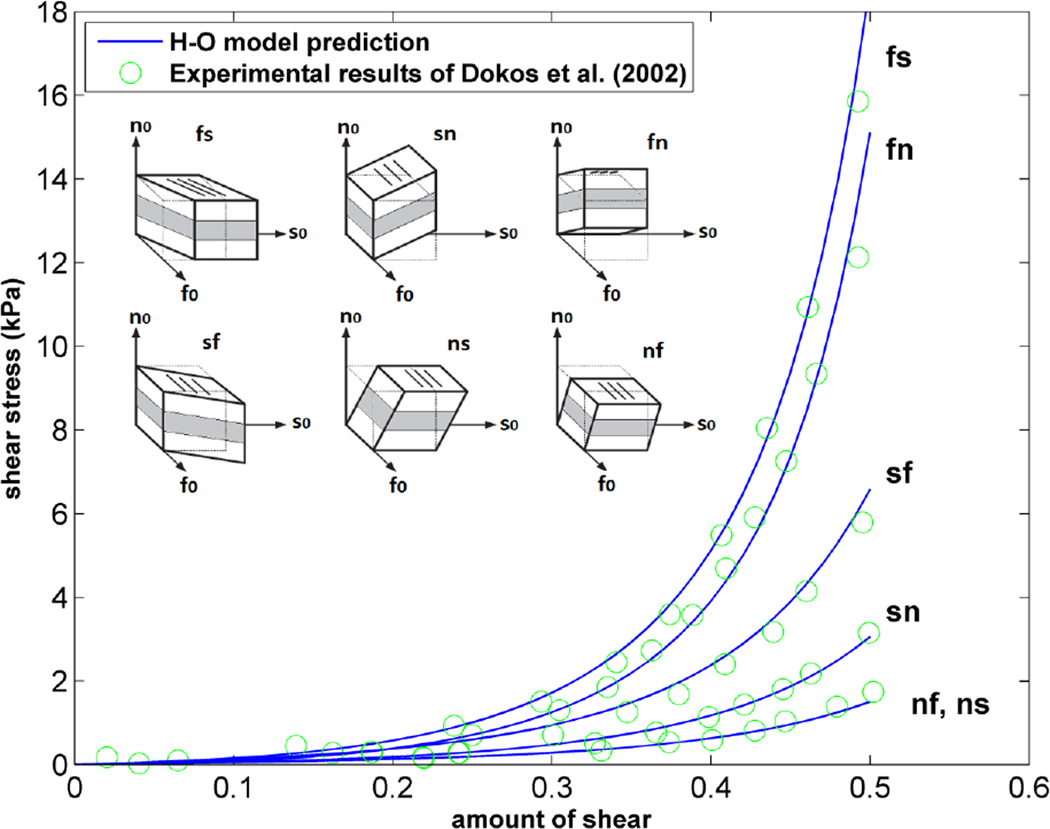
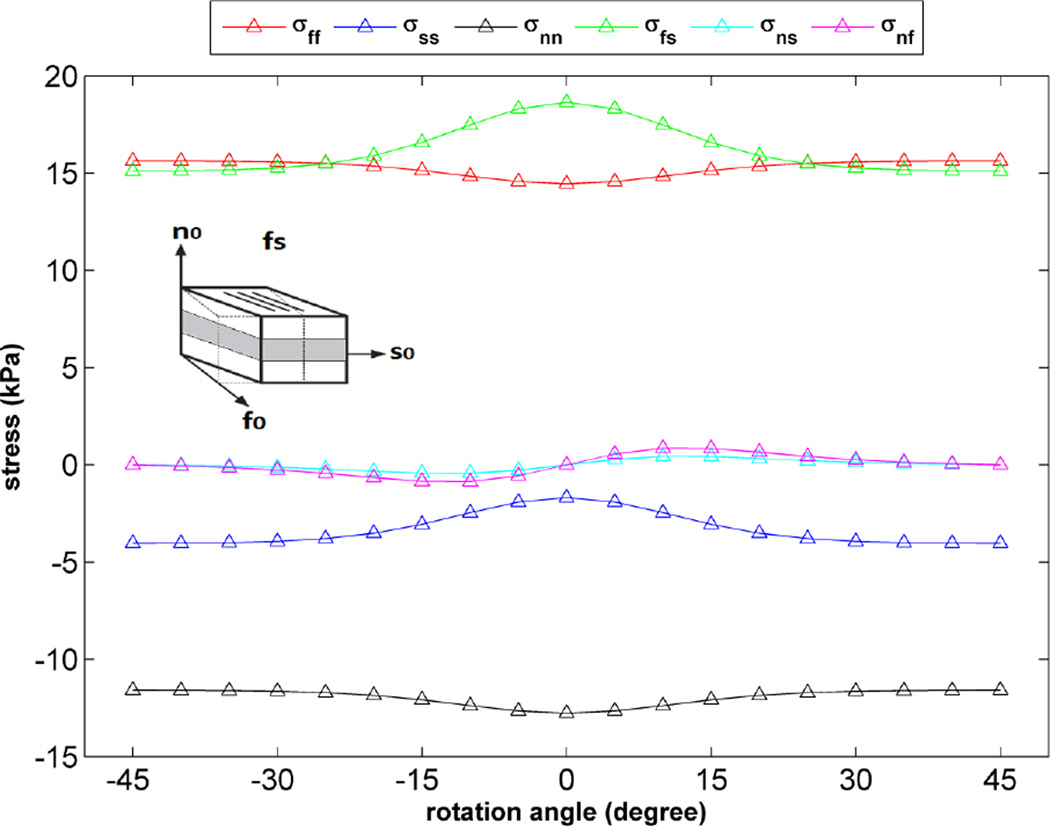
As stated above, in order to validate the implementation of the H-O model into our FE framework, the results of simple shear experiments4 were replicated using the H-O model in a FE simulation of a single element. As shown in Figure 4, there is very good agreement over the entire strain range between our FE results and the experimental data. Additionally, the sensitivity of the H-O model to different orientations of myocyte sheets was tested by calculating different components of stress for one of the simple shear cases shown in Figure 4 (fs shear). To do this, a single element was rotated about the fiber direction from −45 to +45 degrees and a fixed amount of shear (maximum amount of shear shown in the plot of Figure 4) was applied to the element in each orientation angle. The results indicate changes in different components of stress as the sample is rotated (Fig. 5). Obviously, transversely isotropic models of myocardium would not predict such changes.
Figure 4.
Fit of the H-O model (solid lines) to the experimental data (circles) of Dokos et al.4. Material parameters of Goktepe et al.8 used for H-O model.
Figure 5.
Variation of stress components vs. orientation angle of single element (rotation about fiber direction) for one simple shear case (fs shear), the amount of shear applied on the element is fixed (=0.5).
Table 2 shows the final results of the multi-step optimization, yielding eight material parameters of the H-O model for each case under investigation. It should be noted that between steps 1 and 3, the objective function fo1 reduced by an average of 20% (ranging from a 10% to 35% reduction). Thus, there was a significant improvement in the parameter fitting by the end of the multi-step scheme. The individual values for each case are reported in Table 3. The corresponding material parameters using the Guccione model are listed in Table 4. In order to compare the optimization results of the two constitutive models, the optimized parameters in Tables 2 and 4 were used to run FE simulations and then the MSE corresponding to each of the four LV cases was calculated (Table 5). The MSE values for the H-O models ranged from 7.55 – 15.37, while the Guccione models ranged from 7.11 – 14.87. When comparing the results from the H-O and Guccione models, it can be seen that the MSE values for cases 1 through 3 are in close agreement, differing by 3% – 7% from each other, whereas case 4 showed more deviation with a difference of 14%. The reason for the differences between the two constitutive models is discussed in the next section.
Table 2.
Resulting parameters for the H-O model from the multi-step optimization scheme. These represent in-vivo healthy myocardium for the four cases under investigation.
| Parameters | a (kPa) | b | af (kPa) | bf | as (kPa) | bs | afs (kPa) | bfs |
|---|---|---|---|---|---|---|---|---|
| Case 1 | 1.055 | 20.85 | 4.659 | 0.23 | 0.224 | 0.11 | 1.833 | 21.80 |
| Case 2 | 2.401 | 54.05 | 0.271 | 151.00 | 0.128 | 47.33 | 4.176 | 56.50 |
| Case 3 | 0.654 | 20.85 | 6.959 | 2.15 | 3.407 | 1.05 | 1.219 | 21.79 |
| Case 4 | 1.780 | 37.83 | 0.143 | 200.20 | 0.012 | 8.72 | 3.096 | 39.55 |
| Mean | 1.472 | 33.39 | 3.008 | 88.39 | 0.942 | 14.30 | 2.581 | 34.91 |
| Standard Deviation | 0.774 | 15.92 | 3.368 | 102.68 | 1.645 | 22.35 | 1.319 | 16.64 |
Table 3.
Objective function (fo1) values for the first and last step of the multi-step optimization scheme for the H-O model.
| Step 1 (fo1) | Step 3 (fo1) | |
|---|---|---|
| Case 1 | 11.34 | 7.55 |
| Case 2 | 16.99 | 15.37 |
| Case 3 | 13.19 | 10.90 |
| Case 4 | 10.95 | 10.16 |
Table 4.
Resulting parameters for the Guccione model from the single-step optimization scheme. These represent in-vivo healthy myocardium for the four cases under investigation.
| Parameters | C (kPa) | Bf | Bt | Bfs |
|---|---|---|---|---|
| Case 1 | 0.493 | 38.06 | 4.11 | 45.07 |
| Case 2 | 0.589 | 98.44 | 12.36 | 26.45 |
| Case 3 | 0.225 | 93.78 | 11.86 | 18.36 |
| Case 4 | 0.391 | 92.60 | 1.11 | 49.27 |
| Mean | 0.424 | 80.72 | 7.36 | 34.78 |
| Standard Deviation | 0.155 | 28.55 | 5.62 | 14.77 |
Table 5.
MSE between in-vivo MRI and FE predicted strains using two constitutive models and optimized parameters from Tables 2 and 4
| MSE, Holzapfel-Ogden model | MSE, Guccione et al. model | |
|---|---|---|
| Case 1 | 7.55 | 7.11 |
| Case 2 | 15.37 | 14.87 |
| Case 3 | 10.90 | 10.17 |
| Case 4 | 10.13 | 8.64 |
To further explore the compatibility of the model results with the experimental data, the MRI-based strain was analyzed at a time point between early diastole and end-diastole. This experimentally calculated strain field was then compared with the strain field generated from the FE models at the same time point. The model simulations were conducted with the H-O and Guccione constitutive parameters given in Tables 2 and 4, which are from the optimization procedure that only fit end-diastolic strain. The agreement at this intermediate time point was found to be as good as or better than the agreement at end-diastole. For example, the MSE values for case 1 at this intermediate time point were found to be 6.63 and 6.49, for H-O and Guccione, respectively. While the MSE values for case 2 were found to be 15.48 and 15.19, for H-O and Guccione, respectively. This indicates that the models were able to fit the experimental data at time points that were not explicitly used in the fitting procedure.
In order to better understand the influence of the sheet angles on the fit of the H-O models, all of the LV simulations were rerun with sheet angles that aligned with the radial direction, rather than varying by ±45 degrees. As expected, the MSE values for the cases with the Guccione material law were unchanged, due to the transversely isotropic nature of the law. However, the MSE values for the cases with the H-O material law increased by 6%, meaning that the difference between the FE predicted and MRI measured strain increased, leading to a worse fit of the experimental data. This indicates that the H-O model is sensitive to the orthonormal basis that is used to describe the fiber, normal, and sheet directions and that more realistic sheet angles lead to a better fit between the model and experimental data.
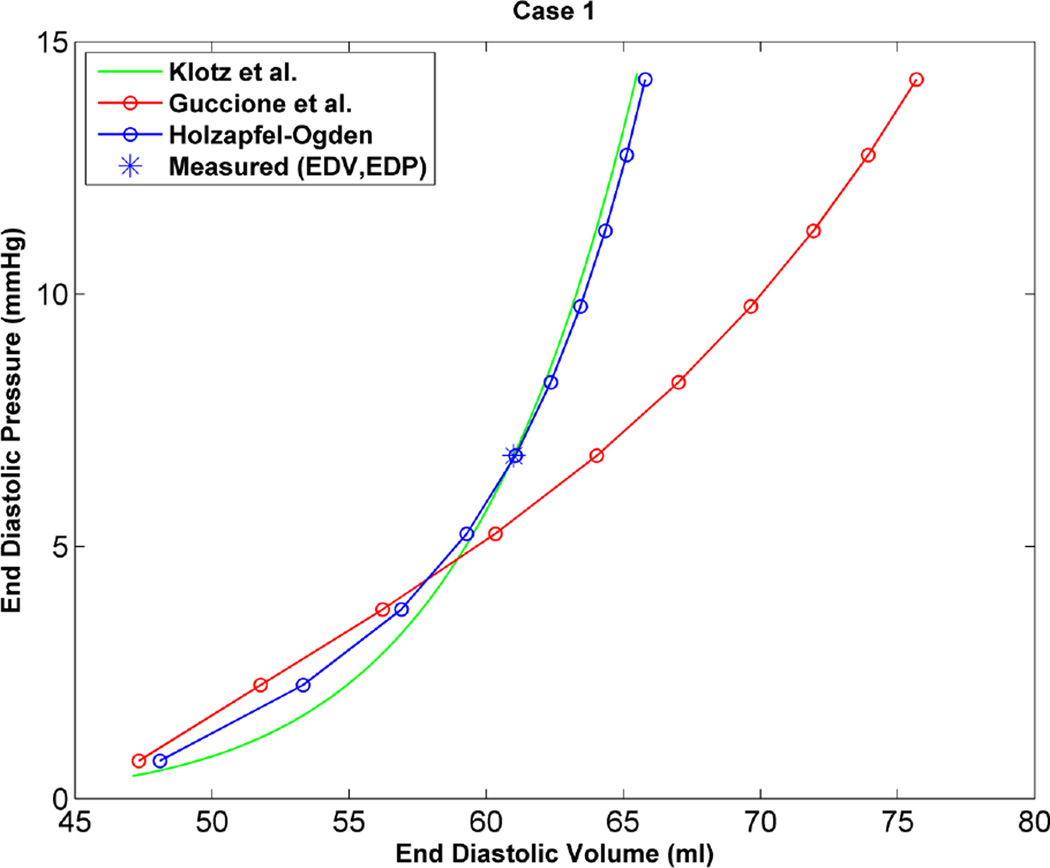
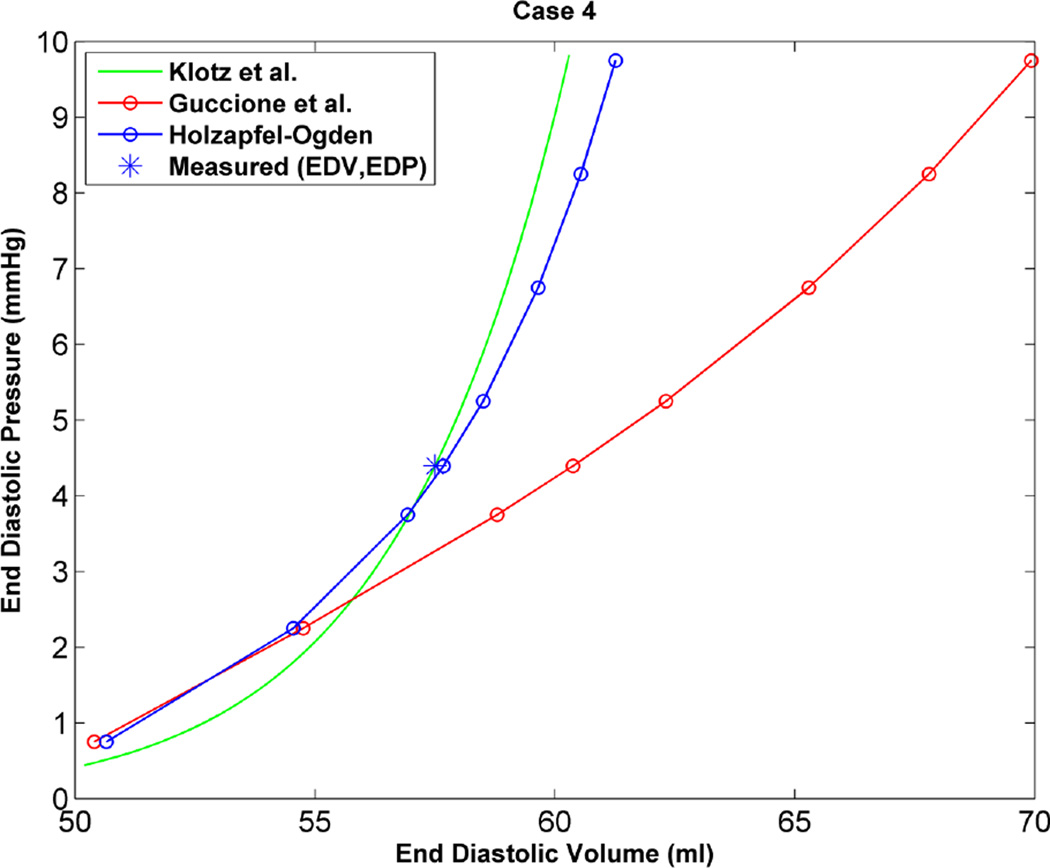
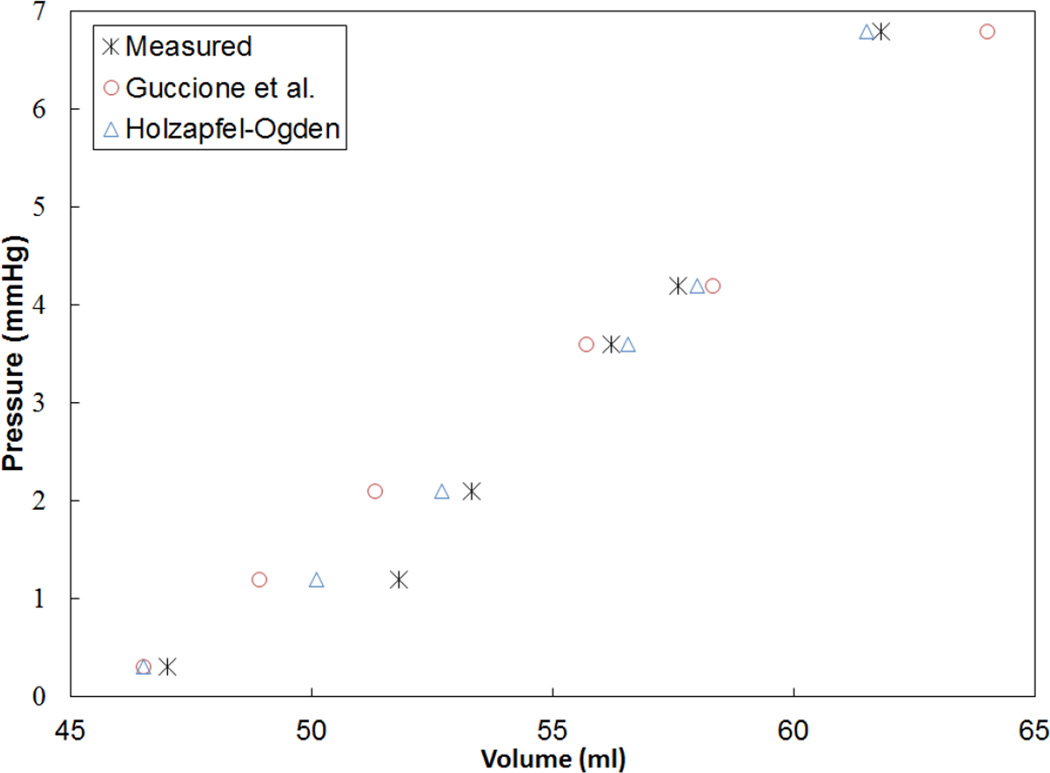
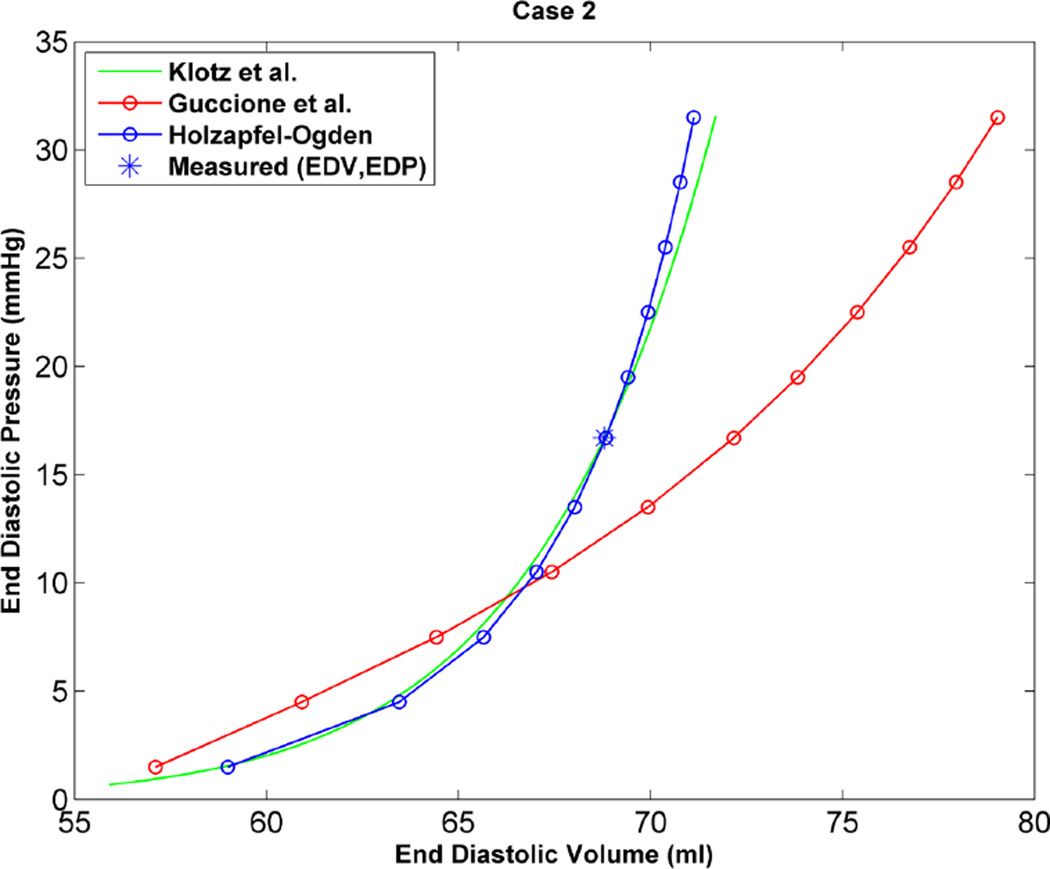
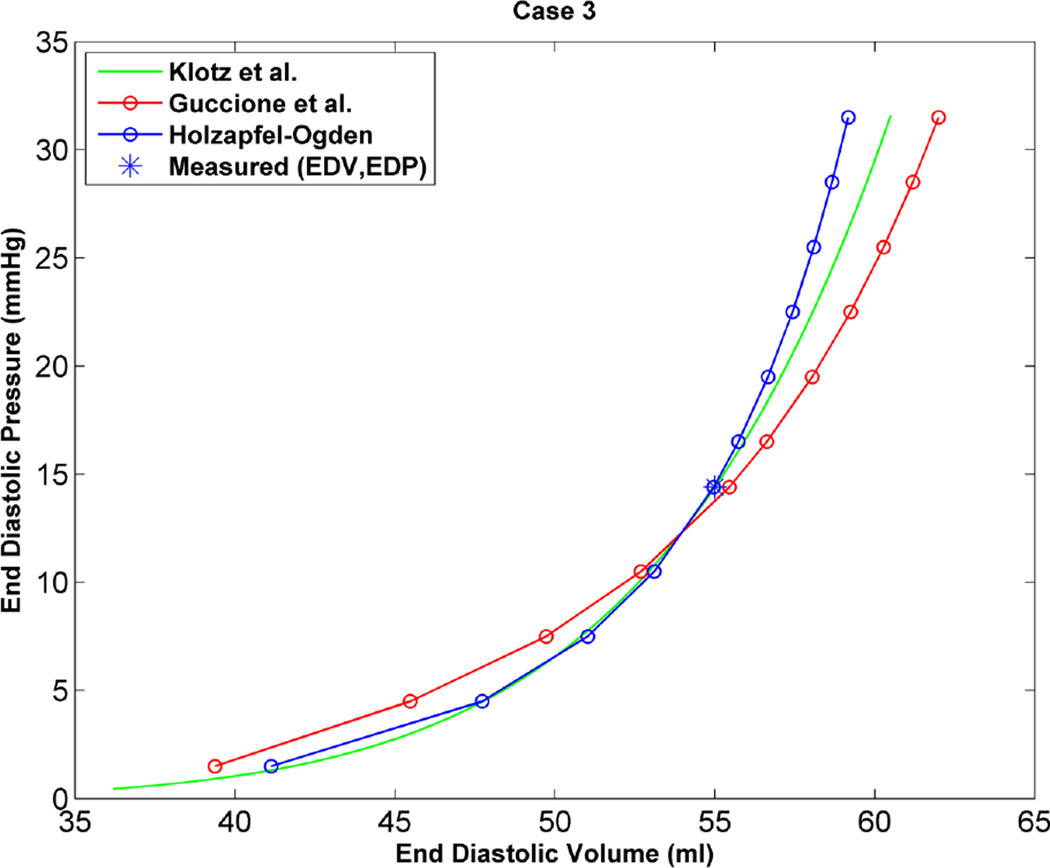
As an additional step to qualitatively compare the results of the two constitutive models, the EDPVR curve was used, which is a powerful tool in both the medical and biomechanics communities since it characterizes the passive properties of the ventricles. Furthermore, the parameter estimation in this study is based on measured strains, cavity volume and pressure at the end of diastole, which justifies the use of the EDPVR curve to have a qualitative understanding of the two different constitutive models. As a benchmark for the EDPVR curve, we used the method developed by Klotz et al.18 They proposed a single-beat approach to estimate the whole EDPVR from one measured volume-pressure point. Figures 6 through 9 show the EDPVR curves obtained using the H-O model, the Guccione model, and the physiological benchmark curve using the Klotz method. These figures clearly show that the H-O model gives better agreement with the Klotz curve. In order to further explore the accuracy of the model, the pressure and volume during diastolic filling were compared between the experimentally measured data and the model results. Figure 10shows the results from case 1 as a representative example. It can be seen that the H-O model yields closer agreement to the measured data, as compared to the Guccione model, over the entire time course.
Figure 6.
EDPVR curve predicted by H-O model (blue), model of Guccione et al. (red) and method of Klotz et al. (green) as a physiological benchmark for case 1.
Figure 9.
EDPVR curve predicted by H-O model (blue), model of Guccione et al. (red) and method of Klotz et al. (green) as a physiological benchmark for case 4.
Figure 10.
Pressure-volume relationship during diastolic filling for case 1, which is representative of all cases. Note the H-O model yields closer agreement to the measured values.
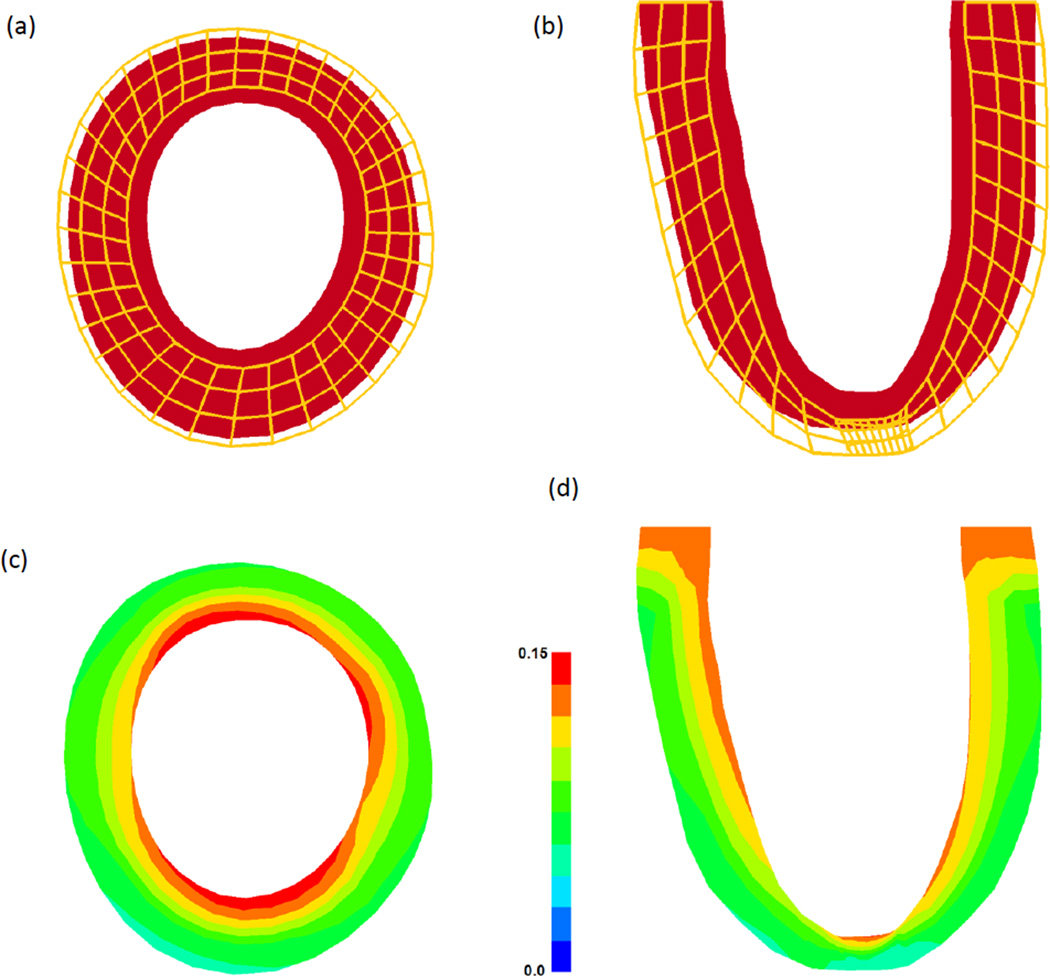
The reference state, deformed state, and maximum principal strains for case 1 are shown in Figure 11. It should be noted that these results are representative of the trends seen in the other cases analyzed in this study. The dilation in the short axis slice of the FE model (Figure 11a) is comparable to that seen in-vivo from the contoured MR images. In order to quantify the deformation more directly, the maximum principal strain distributions are given in Figures 11c and 11d. It can be seen that the strain is highest at the endocardial wall, with a decreasing transmural gradient towards the epicardial wall. This is also consistent with the strain fields measured from the MRI data.
Figure 11.
Reference and deformed state of the FE model for case 1, which is representative of all cases. (a) Short axis slice at mid-ventricle and (b) long axis slice through the remote and infarct region. The shaded region represents the reference state (red) and the wire frame represent the deformed state (orange). Maximum principal strain distribution in the same (c) short axis and (d) long axis slices.
Discussion
The goal of this study was to quantify the eight material parameters of the structurally based H-O constitutive model using in-vivo strain and synchronous pressure data from four healthy porcine LV cases. The parameter estimation was achieved by using a combination of FE simulations and a recently developed optimization scheme specifically for the H-O model.5 Additionally, four material parameters for the widely used Guccione model10 were obtained and the corresponding results compared.
Based on the results of our study, the H-O model was shown to produce a more realistic estimate of the ventricular mechanics, by generating a more physiological EDPVR curve. Figures 6 through 9 show the EDPVR curves obtained using both constitutive models, as well as a physiological benchmark curve using the method by Klotz et al.18 A common trend in all four cases is that the EDPVR curve predicted by the H-O model is closer to the Klotz curve, indicating a physiological EDPVR. The slope of the EDPVR curve is an indicator of the overall stiffness of the myocardium during the passive phase of the cardiac cycle. A closer look at Figures 6 through 9 reveals that the H-O model also predicts the myocardial stiffness more exactly than the Guccione model over a broader range of volumes. In addition, the H-O model appears to capture the nonlinearity more accurately (Figure 10) without using extra volumes from diastolic filling during the optimization process. This is very advantageous, since our results were achieved by fitting the constitutive model to measured data only from end-diastole.
Considering that the identical fiber orientation angles were used in both models, one reason the results of the H-O model is more realistic is that the mathematical formulation takes into account the myocyte sheet angles, which leads to more realistic description of the morphology of the myocardium. The final results in the form of MSE values for the two constitutive laws (Table 5) indicate that MSEs are very close, but the H-O model has MSE values that are slightly higher than the Guccione model. One explanation is that in this study we are assigning assumed distributions of myofiber orientation and myocyte sheet angles to a structurally based model. Structurally based models sense the material only from its assigned architecture, unlike phenomenological models that follow the general behavior of material. This was also observed when the simulations that used the H-O model were assigned more realistic sheet architecture. Specifically, when assigning the assumed variation in sheet angles versus the case when the sheet angles were assumed to be directed radially toward the center of LV, the MSE values decreased indicating a better fit. Obviously, improvement in the sheet angle distribution does not affect the results of transversely isotropic models. Based on the results of four LV cases in this study, the best way to incorporate myocardium architecture when using the H-O model (or any other structurally based constitutive law) is by mapping animal-specific, real fiber and sheet angles (e.g. from DTMRI) to the FE model. This is the subject of future investigations for the authors.
In some studies, the material parameters were obtained by fitting the H-O model to simple shear or biaxial experimental data of ex-vivo heart tissues and then used to simulate beating LVs, (for example see8,32,19). However, in the current study the parameters of the H-O model were quantified using in-vivo strain data from MRI. Despite some studies that used reduced forms of the H-O model with less material parameters (for example see19), in the current study the proposed optimization scheme of Gao et al.5 was used to quantify all eight material parameters. In addition, by using a larger number of 3-D strain data points (252 points, all 6 components of the strain tensor at each point) in the optimization procedure, this adds to the reliability of the optimization results in this study. In the work by Gao et al.5, a smaller number of strain points were used in the optimization, and radial strains were not used to quantify the material parameters of the H-O model. In addition to the quantity of experimental data, the 3D SPAMM MRI data used in this study are more accurate at capturing myocardial deformation than the cine MRI data used in previous studies. Furthermore, in this study synchronous pressure catheterization data was used to load the FE model, while in other implementations of the H-O model average or population based pressure data was used.32,5
The material parameters determined in the current study, using either the Guccione or H-O constitutive model, showed variability from case to case (Tables 2 and 4). It should be noted, this type of variability was seen in several previous studies of normal myocardium, where the values of C, bf, bt, and bfs (from the Guccione model) varied by as much as a factor of 5 within the same group of animals.1, 22, 24, 30 As the stiffness of the ventricle changes, this will directly impact how the LV deforms in response to pressure load. This is evidenced by the variation seem in the EDPVR curves (Figs. 6 to 9). Given the results of the current study, as well as previous studies, there appears to be natural variability in ventricular stiffness within an animal group.
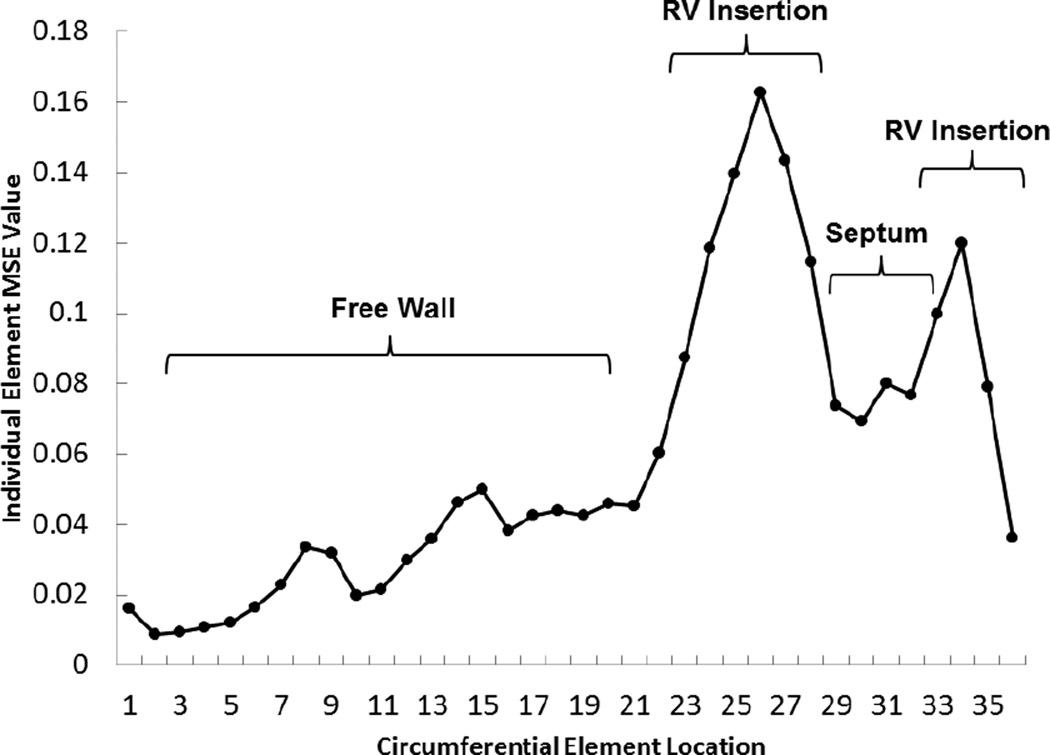
There are some limitations associated with this implementation of the constitutive models. One limitation is that the FE models lack the pericardium and RV. The absence of the RV decreases the accuracy of the estimated parameters as discussed previously by Mojsejenko et al.22 Namely, the local error between the FE predicted strain and MRI measured strain is highest at the RV insertion point (Figure 12), which was consistent in all of the cases. This will be accounted for in future studies by using a bi-ventricular model. Another limitation is using early diastole, where LV is under minor loading, as the reference state of the FE models. Additionally, the residual active tension in the myocardium is not taken into account, which could be a source of error in the parameter estimation. The techniques proposed by Krishnamurthy et al.19 and Xi et al.34 will be used in future investigations to incorporate these effect to the FE model used to estimate parameters. Finally, the use of the multi-step optimization5 scheme for the H-O parameter estimation could produce issues with local minima during the process. Moreover, the accuracy of this scheme is partly dependent on the availability of experimentally obtained parameters for the H-O model, which is not always the case. Finally, a more desirable optimization scheme would result in a single metric of goodness of fit. Despite these limitations, the implementation of the H-O model in the current study demonstrates enhanced capabilities for fitting constitutive models using in-vivo data.
Figure 12.
Spatial distribution of MSE values within each mid-wall element around the circumference of a short axis slice near mid-ventricle of the LV model for case 2, which is representative of all cases.
Conclusions
In this study, material parameters for recently developed structurally based constitutive model, as well as a widely used phenomenological constitutive model, were quantified. The final results indicate that given the rule-based and homogeneous fiber and sheet architecture used for the cases under investigation, the phenomenological model is able to predict a slightly better strain field within the ventricle at end-diastole, but the structurally based model results in a more realistic estimate of the ventricular mechanics in terms of generating a more physiological EDPVR curve. In future studies, animal-specific, real fiber and sheet angles from DTMRI will be used in order to fully utilize this structurally based constitutive model for healthy and diseased myocardium.
Figure 7.
EDPVR curve predicted by H-O model (blue), model of Guccione et al. (red) and method of Klotz et al. (green) as a physiological benchmark for case 2.
Figure 8.
EDPVR curve predicted by H-O model (blue), model of Guccione et al. (red) and method of Klotz et al. (green) as a physiological benchmark for case 3.
Acknowledgments
This study was supported by National Institutes of Health grants R01 HL063954 (R. Gorman), R01 HL111090 (J. Burdick), R01 HL73021 (J. Gorman), and by a grant from the American Heart Association 14BGIA18850020 (J. Wenk).
References
- 1.Augenstein KF, Cowan BR, LeGrice IJ, Young AA. Medical image computing and computer-assisted intervention–miccai 2006. Springer; 2006. Estimation of cardiac hyperelastic material properties from mri tissue tagging and diffusion tensor imaging; pp. 628–635. [DOI] [PubMed] [Google Scholar]
- 2.Baillargeon B, Rebelo N, Fox DD, Taylor RL, Kuhl E. The living heart project: A robust and integrative simulator for human heart function. European Journal of Mechanics - A/Solids. 2014;48(0):38–47. doi: 10.1016/j.euromechsol.2014.04.001. [DOI] [PMC free article] [PubMed] [Google Scholar]
- 3.Costa KD, Holmes JW, McCulloch AD. Modelling cardiac mechanical properties in three dimensions. Philos T Roy Soc A. 2001;359(1783):1233–1250. [Google Scholar]
- 4.Dokos S, Smaill BH, Young AA, LeGrice IJ. Shear properties of passive ventricular myocardium. American Journal of Physiology-Heart and Circulatory Physiology. 2002;283(6):H2650–H2659. doi: 10.1152/ajpheart.00111.2002. [DOI] [PubMed] [Google Scholar]
- 5.Gao H, Carrick D, Berry C, Luo X. Parameter estimation of the holzapfel-ogden law for healthy myocardium. Journal of Engineering Mathematics. 2014 doi: 10.1007/s10665-014-9740-3. [DOI] [PMC free article] [PubMed] [Google Scholar]
- 6.Gasser TC, Ogden RW, Holzapfel GA. Hyperelastic modelling of arterial layers with distributed collagen fibre orientations. Journal of the Royal Society, Interface / the Royal Society. 2006;3(6):15–35. doi: 10.1098/rsif.2005.0073. [DOI] [PMC free article] [PubMed] [Google Scholar]
- 7.Gilbert SH, Benson AP, Li P, Holden AV. Regional localisation of left ventricular sheet structure: Integration with current models of cardiac fibre, sheet and band structure. European journal of cardio-thoracic surgery. 2007;32(2):231–249. doi: 10.1016/j.ejcts.2007.03.032. [DOI] [PubMed] [Google Scholar]
- 8.Göktepe S, Acharya SNS, Wong J, Kuhl E. Computational modeling of passive myocardium. International Journal for Numerical Methods in Biomedical Engineering. 2011;27(1):1–12. doi: 10.1002/cnm.2565. [DOI] [PMC free article] [PubMed] [Google Scholar]
- 9.Grimm A, Katele K, Lin H-L, Fletcher J. Fiber bundle direction in the mammalian heart. Basic research in cardiology. 1976;71(4):381–388. doi: 10.1007/BF01910776. [DOI] [PubMed] [Google Scholar]
- 10.Guccione J, McCulloch A, Waldman L. Passive material properties of intact ventricular myocardium determined from a cylindrical model. Journal of biomechanical engineering. 1991;113(1):42–55. doi: 10.1115/1.2894084. [DOI] [PubMed] [Google Scholar]
- 11.Holzapfel GA. Nonlinear solid mechanics. Chichester: Wiley; 2000. [Google Scholar]
- 12.Holzapfel GA, Ogden RW. Constitutive modelling of passive myocardium: A structurally based framework for material characterization. Philosophical transactions. Series A, Mathematical, physical, and engineering sciences. 2009;367(1902):3445–3475. doi: 10.1098/rsta.2009.0091. [DOI] [PubMed] [Google Scholar]
- 13.Humphrey J, Strumpf R, Yin F. Determination of a constitutive relation for passive myocardium: I. A new functional form. Journal of biomechanical engineering. 1990;112(3):333–339. doi: 10.1115/1.2891193. [DOI] [PubMed] [Google Scholar]
- 14.Humphrey J, Yin F. On constitutive relations and finite deformations of passive cardiac tissue: I. A pseudostrain-energy function. Journal of biomechanical engineering. 1987;109(4):298–304. doi: 10.1115/1.3138684. [DOI] [PubMed] [Google Scholar]
- 15.Hunter P, Nash M, Sands G. Computational electromechanics of the heart. Computational biology of the heart. 1997;12:347–407. [Google Scholar]
- 16.Hunter PJ, Smaill BH. The analysis of cardiac function: A continuum approach. Progress in biophysics and molecular biology. 1988;52(2):101–164. doi: 10.1016/0079-6107(88)90004-1. [DOI] [PubMed] [Google Scholar]
- 17.Kerckhoffs R, Bovendeerd P, Kotte J, Prinzen F, Smits K, Arts T. Homogeneity of cardiac contraction despite physiological asynchrony of depolarization: A model study. Annals of biomedical engineering. 2003;31(5):536–547. doi: 10.1114/1.1566447. [DOI] [PubMed] [Google Scholar]
- 18.Klotz S, Hay I, Dickstein ML, Yi G-H, Wang J, Maurer MS, Kass DA, Burkhoff D. Single-beat estimation of end-diastolic pressure-volume relationship: A novel method with potential for noninvasive application. American Journal of Physiology-Heart and Circulatory Physiology. 2006;291(1):H403–H412. doi: 10.1152/ajpheart.01240.2005. [DOI] [PubMed] [Google Scholar]
- 19.Krishnamurthy A, Villongco CT, Chuang J, Frank LR, Nigam V, Belezzuoli E, Stark P, Krummen DE, Narayan S, Omens JH. Patient-specific models of cardiac biomechanics. Journal of computational physics. 2013;244:4–21. doi: 10.1016/j.jcp.2012.09.015. [DOI] [PMC free article] [PubMed] [Google Scholar]
- 20.Lee W-N, Pernot M, Couade M, Messas E, Bruneval P, Bel A, Hagege AA, Fink M, Tanter M. Mapping myocardial fiber orientation using echocardiography-based shear wave imaging. Medical Imaging, IEEE Transactions on. 2012;31(3):554–562. doi: 10.1109/TMI.2011.2172690. [DOI] [PubMed] [Google Scholar]
- 21.LeGrice IJ, Smaill B, Chai L, Edgar S, Gavin J, Hunter PJ. Laminar structure of the heart: Ventricular myocyte arrangement and connective tissue architecture in the dog. American Journal of Physiology-Heart and Circulatory Physiology. 1995;38(2):H571. doi: 10.1152/ajpheart.1995.269.2.H571. [DOI] [PubMed] [Google Scholar]
- 22.Mojsejenko D, McGarvey JR, Dorsey SM, Gorman JH, III, Burdick JA, Pilla JJ, Gorman RC, Wenk JF. Estimating passive mechanical properties in a myocardial infarction using mri and finite element simulations. Biomechanics and modeling in mechanobiology. 2015;14(3):633–647. doi: 10.1007/s10237-014-0627-z. [DOI] [PMC free article] [PubMed] [Google Scholar]
- 23.Nair AU, Taggart DG, Vetter FJ. Optimizing cardiac material parameters with a genetic algorithm. Journal of biomechanics. 2007;40(7):1646–1650. doi: 10.1016/j.jbiomech.2006.07.018. [DOI] [PubMed] [Google Scholar]
- 24.Okamoto RJ, Moulton MJ, Peterson SJ, Li D, Pasque MK, Guccione JM. Epicardial suction: A new approach to mechanical testing of the passive ventricular wall. Journal of biomechanical engineering. 2000;122(5):479–487. doi: 10.1115/1.1289625. [DOI] [PubMed] [Google Scholar]
- 25.Sands GB, Gerneke DA, Hooks DA, Green CR, Smaill BH, Legrice IJ. Automated imaging of extended tissue volumes using confocal microscopy. Microsc. Res. Tech. 2005;67(5):227–239. doi: 10.1002/jemt.20200. [DOI] [PubMed] [Google Scholar]
- 26.Schmid H, Nash M, Young A, Hunter P. Myocardial material parameter estimation—a comparative study for simple shear. Journal of biomechanical engineering. 2006;128(5):742–750. doi: 10.1115/1.2244576. [DOI] [PubMed] [Google Scholar]
- 27.Spotnitz HM, Spotnitz WD, Cottrell TS, Spiro D, Sonnenblick EH. Cellular basis for volume related wall thickness changes in the rat left ventricle. Journal of molecular and cellular cardiology. 1974;6(4):317–331. doi: 10.1016/0022-2828(74)90074-1. [DOI] [PubMed] [Google Scholar]
- 28.Streeter DD, Spotnitz HM, Patel DP, Ross J, Sonnenblick EH. Fiber orientation in the canine left ventricle during diastole and systole. Circulation research. 1969;24(3):339–347. doi: 10.1161/01.res.24.3.339. [DOI] [PubMed] [Google Scholar]
- 29.Sun K, Stander N, Jhun C-S, Zhang Z, Suzuki T, Wang G-Y, Saeed M, Wallace AW, Tseng EE, Baker AJ. A computationally efficient formal optimization of regional myocardial contractility in a sheep with left ventricular aneurysm. Journal of biomechanical engineering. 2009;131(11):111001. doi: 10.1115/1.3148464. [DOI] [PMC free article] [PubMed] [Google Scholar]
- 30.Walker JC, Ratcliffe MB, Zhang P, Wallace AW, Fata B, Hsu EW, Saloner D, Guccione JM. Mri-based finite-element analysis of left ventricular aneurysm. American Journal of Physiology-Heart and Circulatory Physiology. 2005;289(2):H692–H700. doi: 10.1152/ajpheart.01226.2004. [DOI] [PubMed] [Google Scholar]
- 31.Wang H, Luo X, Gao H, Ogden R, Griffith B, Berry C, Wang T. A modified holzapfel-ogden law for a residually stressed finite strain model of the human left ventricle in diastole. Biomechanics and modeling in mechanobiology. 2014;13(1):99–113. doi: 10.1007/s10237-013-0488-x. [DOI] [PMC free article] [PubMed] [Google Scholar]
- 32.Wang HM, Gao H, Luo XY, Berry C, Griffith BE, Ogden RW, Wang TJ. Structure-based finite strain modelling of the human left ventricle in diastole. Int j numer method biomed eng. 2013;29(1):83–103. doi: 10.1002/cnm.2497. [DOI] [PubMed] [Google Scholar]
- 33.Wenk JF, Papadopoulos P, Zohdi TI. Numerical modeling of stress in stenotic arteries with microcalcifications: A micromechanical approximation. Journal of biomechanical engineering. 2010;132(9):091011. doi: 10.1115/1.4001351. [DOI] [PubMed] [Google Scholar]
- 34.Xi J, Lamata P, Niederer S, Land S, Shi W, Zhuang X, Ourselin S, Duckett SG, Shetty AK, Rinaldi CA. The estimation of patient-specific cardiac diastolic functions from clinical measurements. Medical image analysis. 2013;17(2):133–146. doi: 10.1016/j.media.2012.08.001. [DOI] [PMC free article] [PubMed] [Google Scholar]
- 35.Xu C, Pilla JJ, Isaac G, Gorman JH, 3rd, Blom AS, Gorman RC, Ling Z, Dougherty L. Deformation analysis of 3d tagged cardiac images using an optical flow method. J Cardiovasc Magn Reson. 2010;12:19. doi: 10.1186/1532-429X-12-19. [DOI] [PMC free article] [PubMed] [Google Scholar]
- 36.Young A, LeGrice I, Young M, Smaill B. Extended confocal microscopy of myocardial laminae and collagen network. Journal of Microscopy. 1998;192(2):139–150. doi: 10.1046/j.1365-2818.1998.00414.x. [DOI] [PubMed] [Google Scholar]


