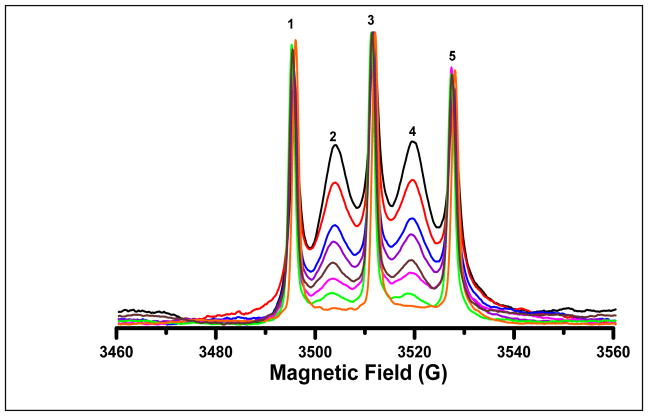
Figure 5.
Integrated X-band CW spectra at 20°C showing changes during the cleavage of dinitroxide I (0.5 mM) by glutathione (0.5 mM). Time 0 (
 ), 30 min (
 ), 60 min (
 ), 90 min (
 ), 120 min (
 ), 150 min (
 ), and 180 min (
 ) after adding glutathione. To obtain the limiting spectrum after 24 hr (
 ) the sample was stored at 4°C overnight. The spectra were scaled to constant amplitude for the highest peak.

