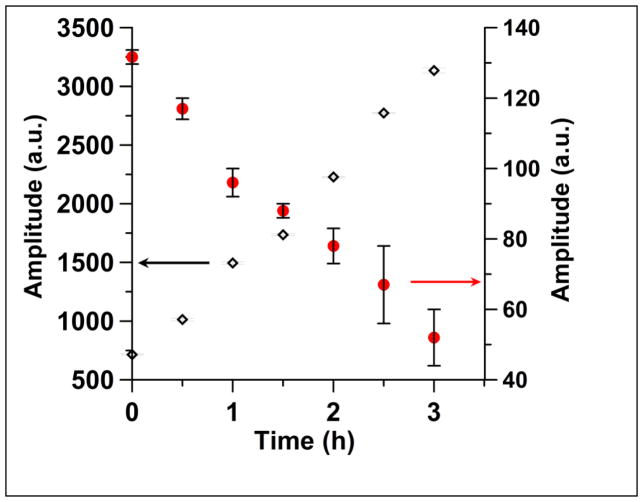
Figure 6.
Time dependence of the peak-to-peak amplitudes of lines 1 (◇) and line 2 (●) in the first-derivative spectra after addition of glutathione (0.5 mM) to I (0.5 mM). The amplitude of line 1 increases by more than a factor of 3 as I is converted to Ia, because the linewidth of line 1 is narrower for Ia than for I. The error bars are three times the standard deviations calculated for three spectra recorded in rapid succession. The arrows indicate the y-axis scale that corresponds to each data set.

