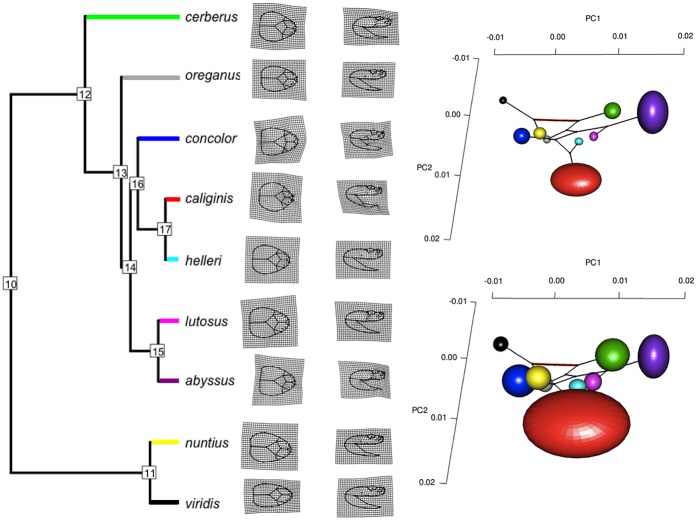
Fig 4. Phylogeny, transformation grids, and head shape variation within and among subspecies of the Western Rattlesnake (Crotalus viridis) complex.
Left: A well-resolved Bayesian phylogenetic hypothesis was derived from six concatenated mtDNA sequences (to include an outgroup, Crotalus scutulatus, subsequently pruned from the tree). Nodes are numbered according to ancestral character states estimated (Table 1). Posterior node probabilities are 1.00, except for node 14, which is 0.99. Transformation grids that denote the deviation from mean form were derived for all nine subspecies using both dorsal and lateral landmark configurations. Transformation grids illustrate the shift from a more ovoid head shape in the eastern (viridis + nuntius) lineage to a more stereotypic, spearheaded morphology in the western lineage (cerberus + oreganus + concolor + helleri + caliginis + lutosus + abyssus). In addition, sister subspecies reflect a shift from an elongate snout and compressed head in the larger, more widespread form (i.e. viridis, helleri, and lutosus), to a shorter, more compact, and less compressed head shape in the diminutive forms (i.e. nuntius, caliginis, and abyssus, respectively). Right: The subspecies shapes correspond to mean positions in the among-subspecies PC plots. Ellipsoids represent scaling of one standard error of the mean (top) and 95% confidence limits (bottom) for each PC. The three PCs account for 58.0% of the variation among subspecies. Colors of ellipsoids match subspecies, as depicted in terminal branches of the phylogeny. The ancestral states and phylogeny edges are projected into the PC plots to facilitate interpretations. The bolder red edge corresponds to node 10, which separates clades.

