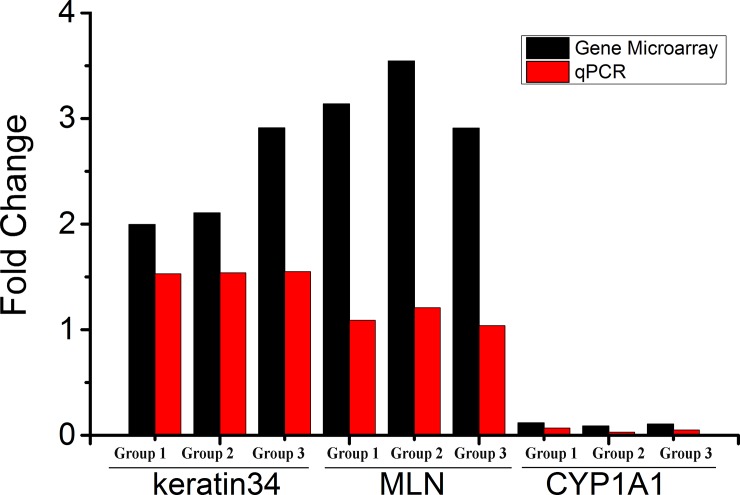
Fig 4. qPCR validation of the expressed genes.
For the 3 randomly selected differentially expressed genes, the fold changes of the genes in the short and natural photoperiods were assessed by qPCR (red bar) and compared to those detected in the gene chip microarray (black bar). All Ct values were normalized to GAPDH, and replicates (n = 3) of each sample were run. The P values (T-test) of the Q-PCR data are 0.1096 (keratin 34), 0.0003 (MLN), and 0.0201 (CYP1A1).

