
Fig 2. Effect of different MWs of HA on the MSC-mediated inhibition of PBL proliferation.
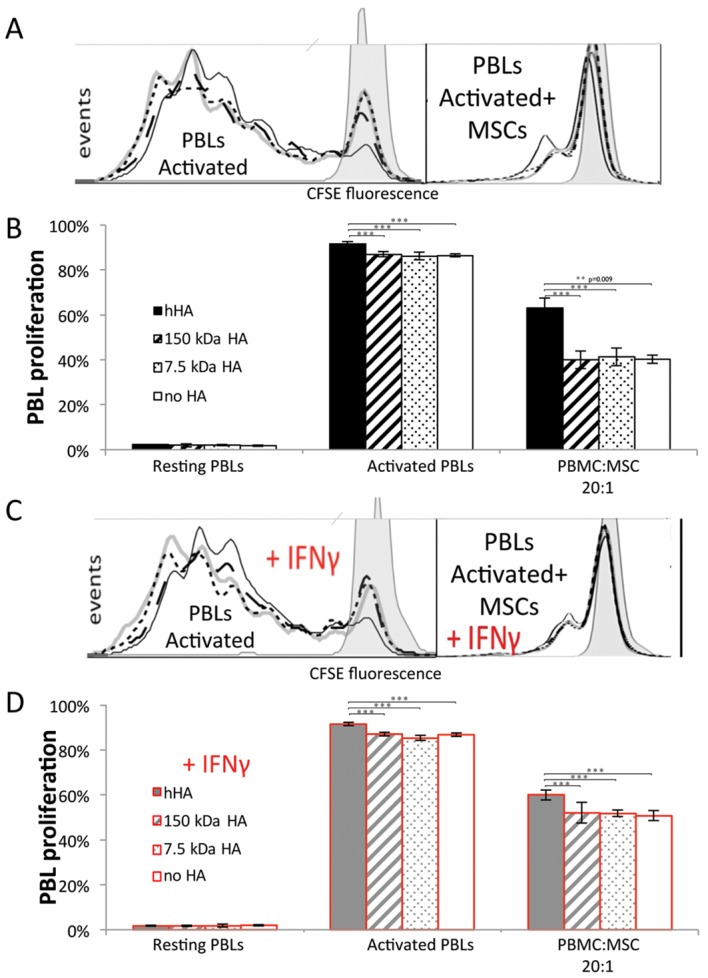
(A) and (C) representative histograms of carboxyfluorescein succinimidyl ester (CFSE) fluorescence. Lines: Black solid line, hHA; black dashed line, 150 kDa HA; black dotted line, 7.5 kDa HA; and gray solid line, no HA. Gray shaded histogram represents resting PBMC control. (B) and (D) PBL proliferation from the whole PBMC population. (A) and (B), normal conditions. (C) and (D), IFNγ-supplemented conditions. Solid filled bars stand for hHA; hatched bars, 150 kDa HA; dotted bars, 7.5 kDa HA and empty bars, no HA. Black color, normal conditions and gray color with red frame, IFNγ-supplemented conditions. All data shown is from one representative MSC donor; additional data from three other donors and at different PBMC:MSC ratios are shown in S4 Fig. Error bars represent 95% CI. Statistical differences in the presence of MSCs account for MSCs from 4 donors, each tested in triplicate. Statistical differences in the absence of MSCs account for PBMCs from one donor tested in quadruplicate. * p<0.05, ** p<0.01 and ***<0.001.