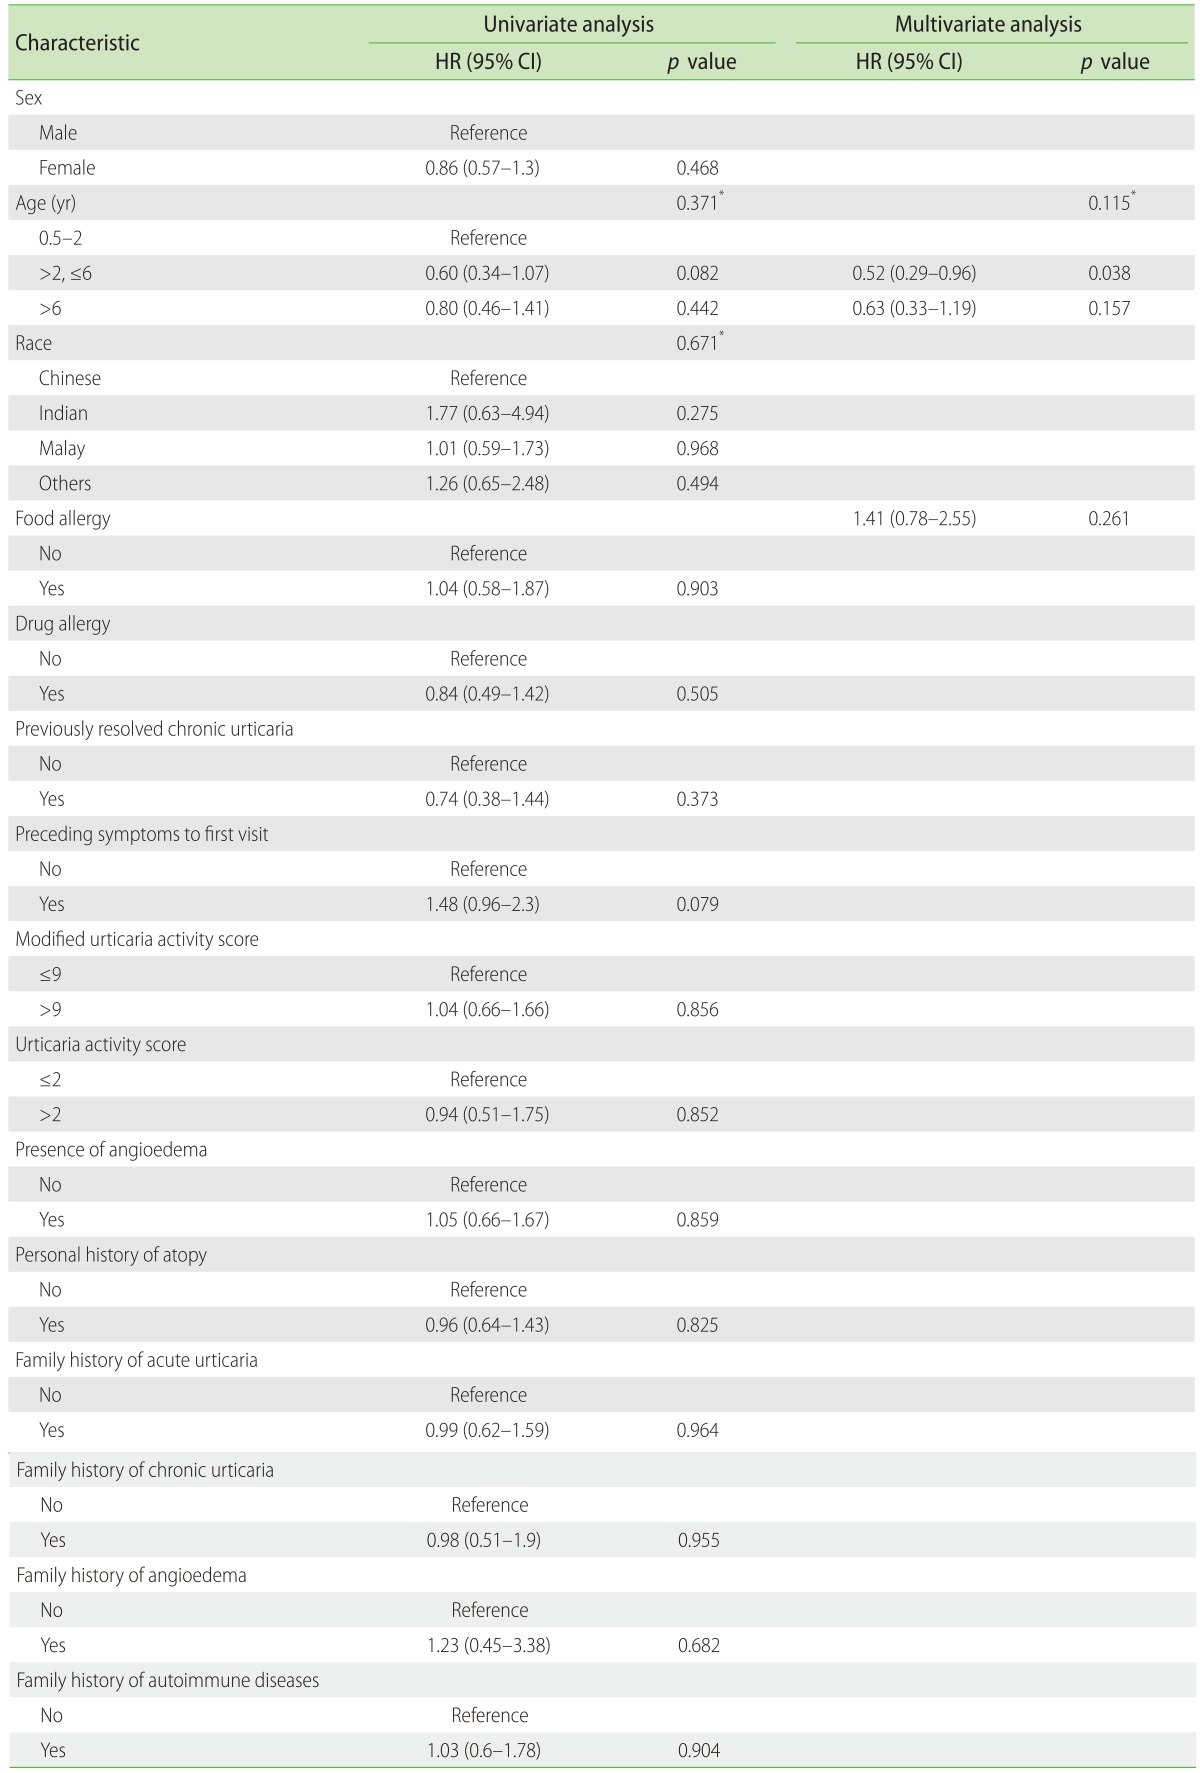
Table 6. Univariate and multivariate analysis demonstrating the relationship of time to control of chronic spontaneous urticaria symptoms (weeks) with demographic data using the Log-rank test and Cox regression analysis.
HR, hazard ratio; CI, confidence interval; AIC, Akaike Information Criterion.
*Type III p value. AIC = 100.346 (multivariate model).

