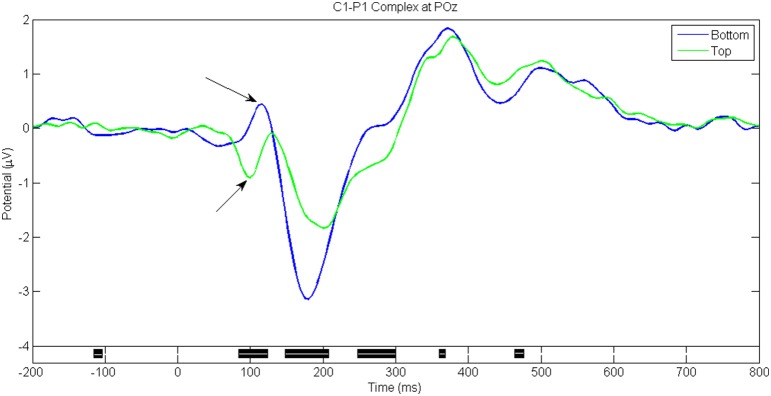
Figure 5.
C1-P1 Complex for game level Who. Seen at electrode POz around 100 ms post stimulus. Note the opposite polarities seen for Top and Bottom stimuli. Black bars in the bottom panel indicate regions of significant difference between conditions (p < 0.05, Paired t-test with 2000 permutations with FDR correction).

