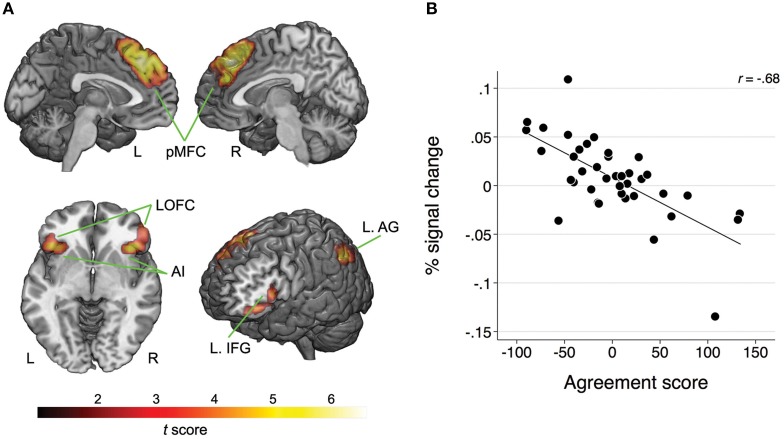
Figure 2.
(A) Map of clusters showing a significant association between the BOLD response and the agreement scores for the Disagree minus Agree contrast; pMFC, posterior medial frontal cortex; AI, anterior insula; IFG, inferior frontal gyrus; LOFC, lateral orbitofrontal cortex; AG, angular gyrus; L, left; R, right. For MNI coordinates of peak voxels and statistics refer to Table 1. (B) Scatterplot and fitted line illustrating the negative relationship between the BOLD response (averaged across all clusters) and agreement scores for the Disagree minus Agree contrast. Lower scores on the agreement score indicate that the participants were less likely to disagree.

