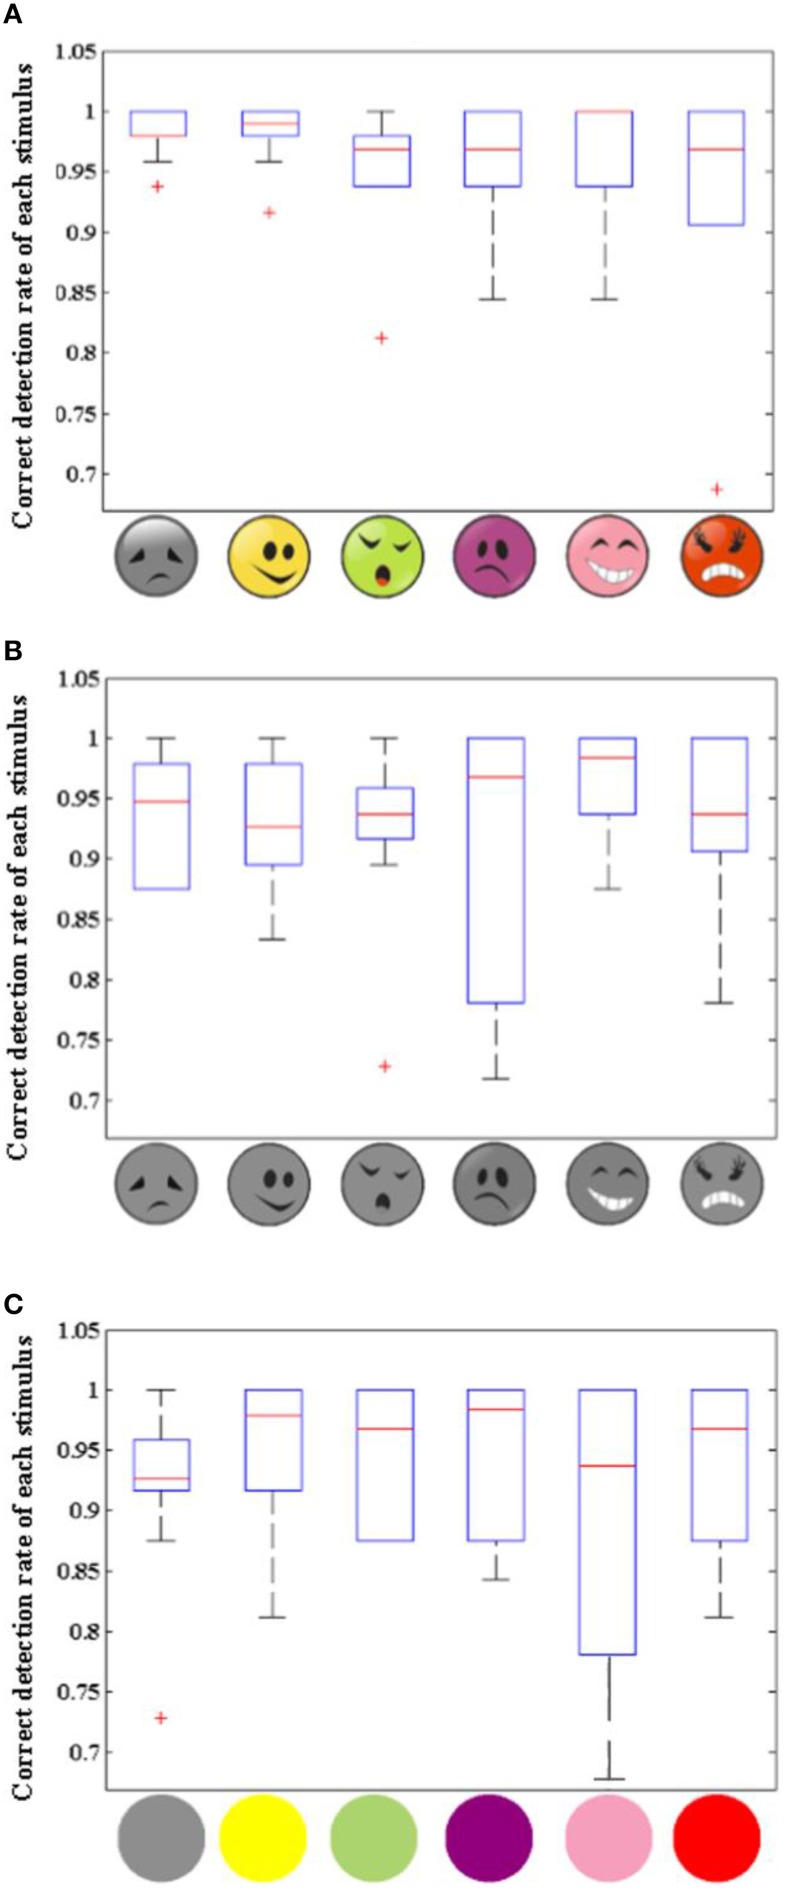
Figure 9.
Boxplot of correct detection rate of each stimulus for 10 participants. Panels (A), (B), and (C) are the Boxplots of correct detection rate of each stimulus across all 10 participants for the colored dummy face pattern (A), the gray dummy face pattern (B), and the colored ball pattern (C), respectively.

