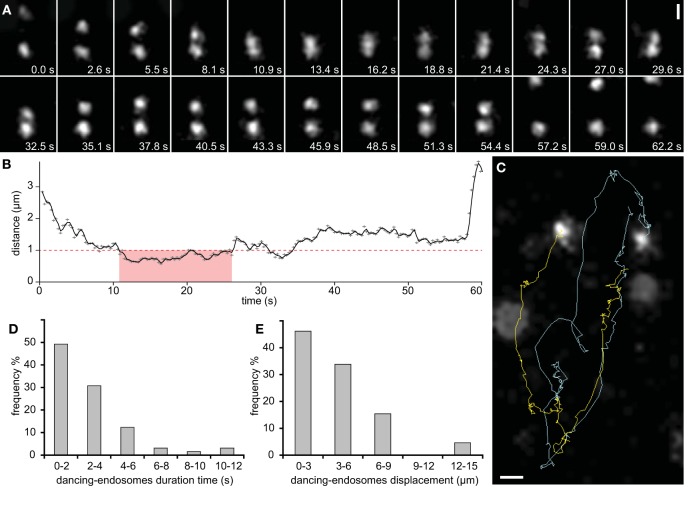
Figure 5.
Dancing endosomes visualized with GFP-2xFYVE. (A) Two late endosomes approach each other and move together forth and back through the cell for almost 1 min before they separate from each other (observation in a single slice). (B) Their synchronized movement was accompanied by changes in distance over time. Physical interactions between them were recognized at closest distance, which was < 1 μm (marked by red dashed line) and within short time period (marked by pink color). (C) Automatic tracking of dancing-endosomes. (D) Frequency of dancing-endosomes with respect to the time. (E) Frequency of dancing-endosomes with respect to their displacement distance, recorded during their close interactions. Sixty-five endosomes from 19 growing root hairs were used for speed and distance estimations during dancing interaction of endosomes. Scale bars represent 1 μm for (A,C). See also Supplementary Movies S3, S4.

