Figure 7.

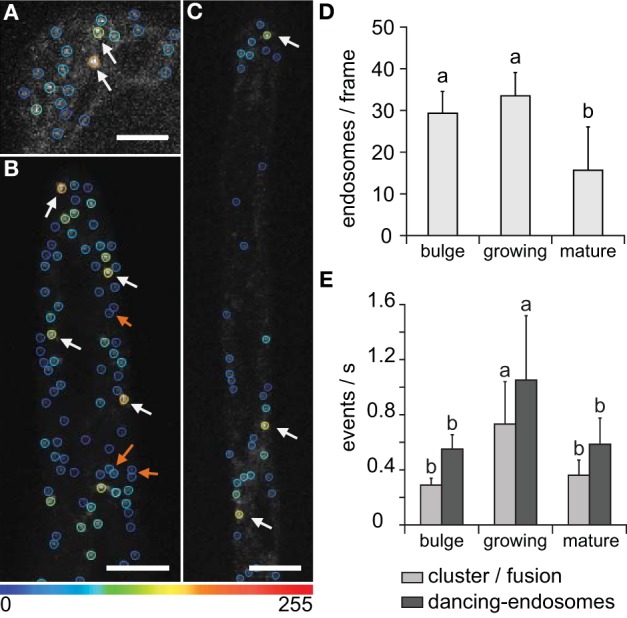
Interactions of late endosomes visualized by GFP-2xFYVE during different phases of root hair development. (A–C) Color-coded marking of individual and clustered/fused endosomes in bulge stage (A), in growing root hair (B), and in mature root hair (C). Increase in total fluorescence intensity after clustering/fusion changed color-coding of late endosomes from blue to yellow and orange (white arrows). The physical interaction of dancing-endosomes is determined by nearby location or temporal increase in fluorescence intensity (orange arrows). All images correspond to one z-frame selected from acquired xyzt-series, color coding showing the intensity changes after 5 s of recording. (D) Endosomal population among different root hair developmental stages. (E) Quantification of dancing-endosomes and clustering/fusions of late endosomes per second in the bulge and in the apical zone (first 10 μm at root hair tip) of growing and mature root hairs. Single Z-stack time series of six root hairs at bulge stage, six of mature root hairs, and 24 of growing root hairs were used to define the endosomal population (using single image, D) and time series to define and follow endosomal behavior (E). Error bars represent SD. Different letters above the bars indicate significant difference (Student t-test, p < 0.05). Scale bar represents 10 μm.
