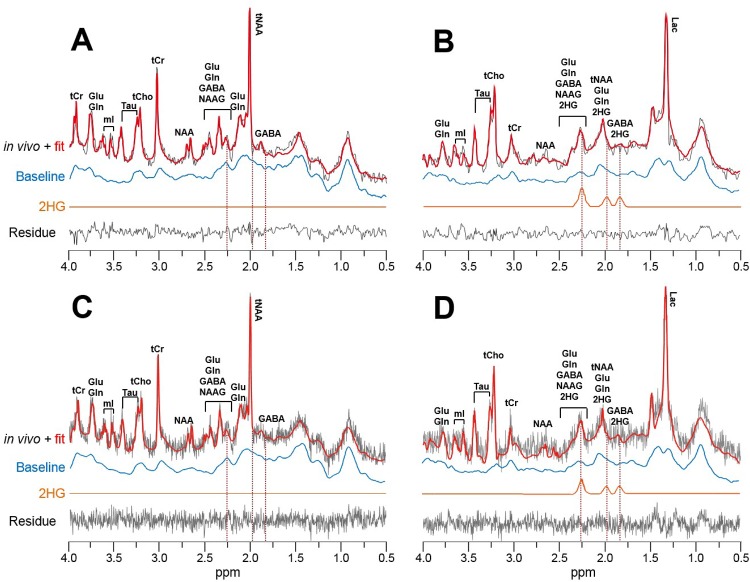
Fig 3. Representative 1H–MRS spectra.
(A and C) A contralateral normal brain region (CN VOI). (B and D) A brain tumor region (tumor VOI) with F98 IDH2–R172K glioma. All spectra were post–processed with voxel–specifically obtained spectral baselines by using either MRUI (A and B) or LCModel (C and D). The resulting residual of fit and the 2HG spectral components are also shown, which were denoted by dashed lines in ~1.8–2.3 ppm. (2HG: 2–hydroxyglutarate, GABA: gamma–aminobutylic acid, Gln: glutamine, Glu: glutamate, Lac: lactate, mI: myo–inositol, NAA: N–acetylaspartate, NAAG: N–acetylaspartylglutamate, Tau: taurine, tCho: total choline, tCr: total creatine, tNAA: total N–acetylaspartate).

