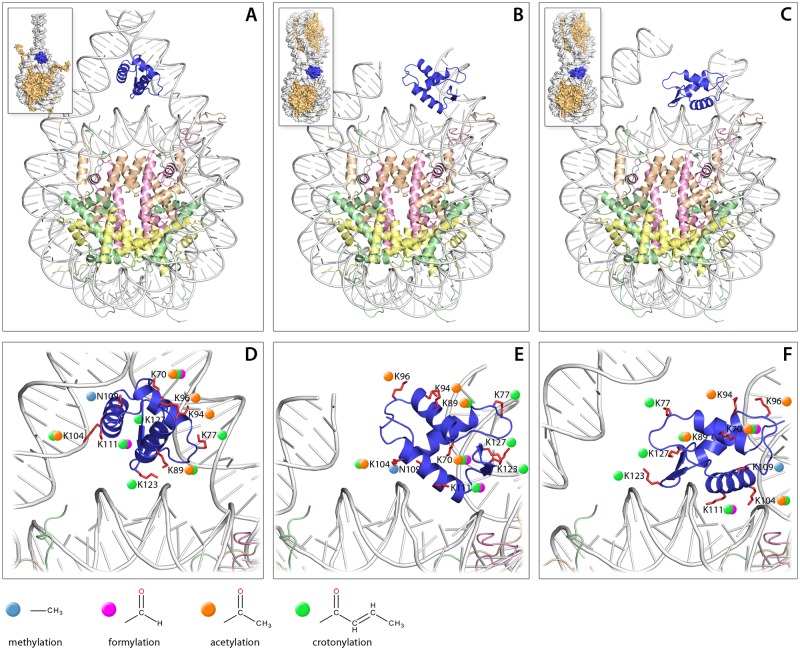
Fig 3. 3D models of the GH1 domain of Arabidopsis H1.2 in complex with a nucleosome.
(A) symmetric model of GH1-nucleosome complex from Syed et. al. [1], (B) asymmetric model from Zhou et. al. [2], (C) asymmetric model from Song et. al. [3]. The presented structures correspond to the respective H1-nucleosome models obtained from the authors, with the original GH1 replaced by the 3D model of the Arabidopsis H1.2 GH1 (blue). Schematic representations of GH1-mononucleosome and GH1-dinucleosome complexes are shown in the upper left corners. (D-F) Enlargement of GH1 binding with residues targeted by post-translational modifications shown in red. The identified modifications are denoted by colored dots: methylation—magenta; formylation—olive; acetylation—green; crotonylation—blue. The models in D, E and F are shown in the same orientation as those in A, B and C, respectively.

