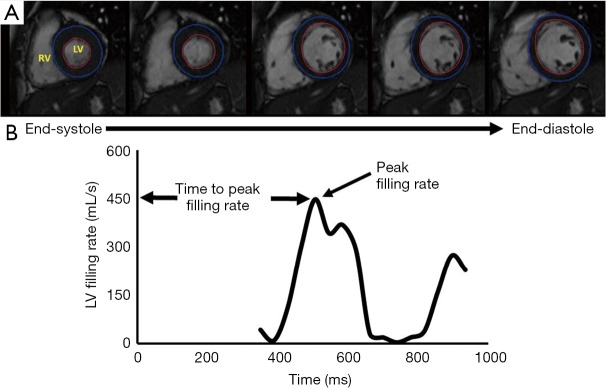
Figure 2.
Volumetric filling rate. (A) Representative cinematic images beginning from end systole and advancing to end diastole, illustrating left ventricular (LV) filling over time. LV endocardial border is highlighted using the red tracing whereas the epicardial border is highlighted with the blue tracing; (B) representative volumetric filling profile from a control patient, illustrating a change in volume over time. Peak filing is taken as the highest rate of LV filing. Time to peak filing is the time from ventricular depolarization (QRS complex) to the peak ventricular filing rate.

