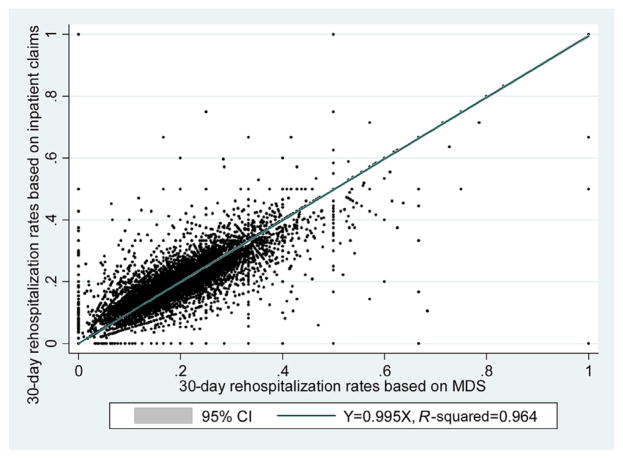
Fig. 2.
Scatter plot of NH–level 30-day rehospitalization rates calculated from inpatient claims data onto rates calculated from MDS data. The 95% confidence interval (CI) of this coefficient using robust SE is 0.992–1.000. Estimated coefficient is 0.962 and R2 is 0.93 if we do not use number of patients in the NH as weighing factor.

