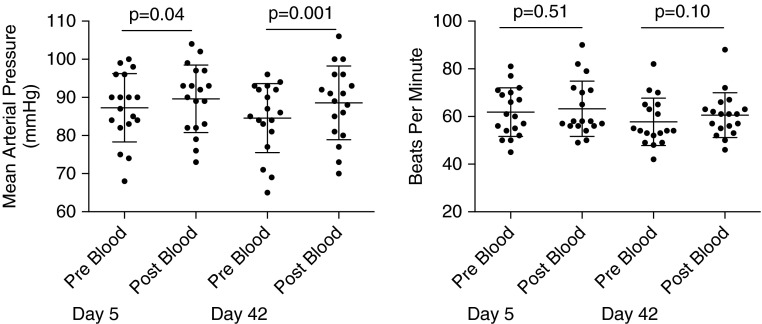
Figure 6.
Mean arterial blood pressure and heart rate. Mean arterial pressures and heart rate values were obtained immediately pre– and post–red blood cell infusion. There is a statistically significant increase in systemic pressures post–blood infusion that was not demonstrated with heart rate, indicating that the mean arterial pressure response was not likely catecholamine driven. Values are expressed as mean (SD).

