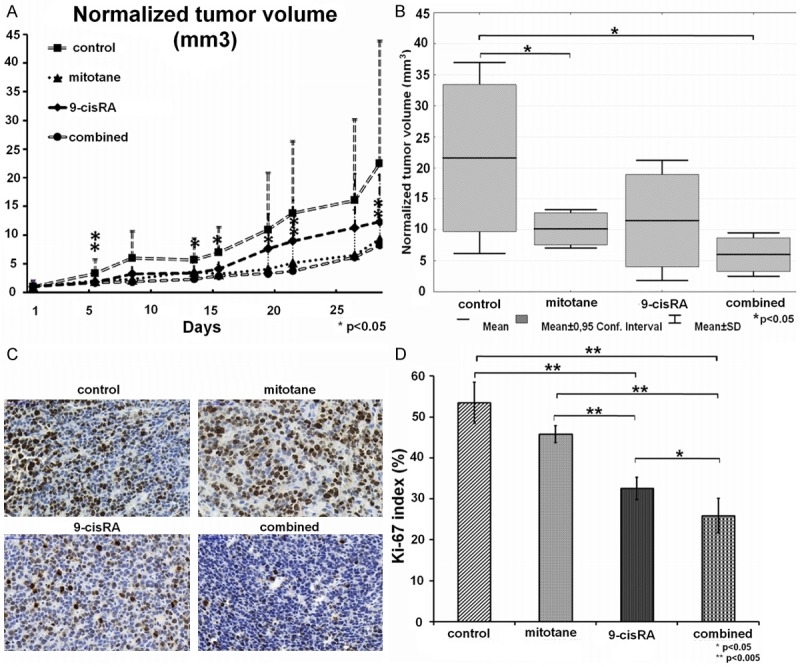
Figure 1.

A. Normalized tumor volumes; B. Normalized tumor volumes at the end of the treatments on day 28; C. Representative images of the Ki-67 immunhistochemical analysis from the four treatment groups; D. Numerical values of the Ki-67 immunhistochemical analysis. (Average results by three independent investigators).
