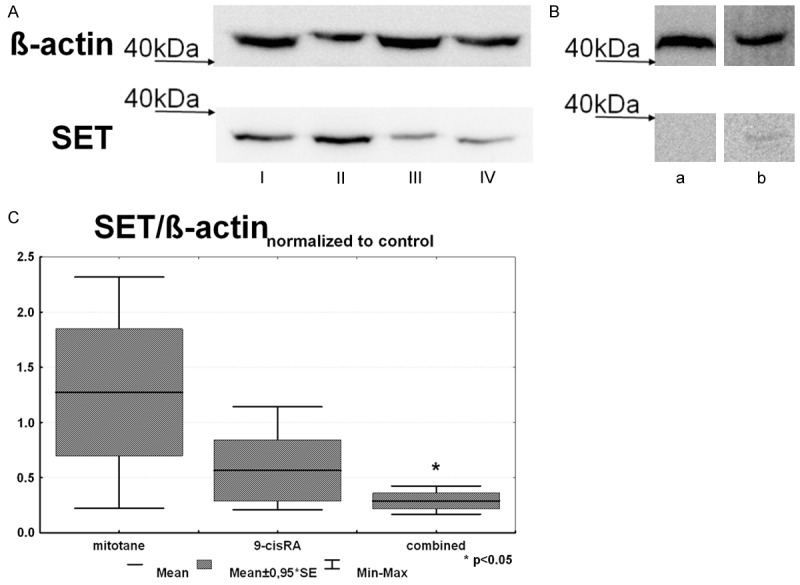
Figure 3.

Results of Western-blot analysis of SET expression. A: Representative image SET expression in the xenograft model: I: Mitotane, II: Control, III: 9-cisRA, IV: Combined treatment group; B: Representative image of SET expression from a normal human adrenocortical cortex (a) and ACC tissue (b); C: Results of the densitometry analysis of SET expression in the xenograft model (n=3).
