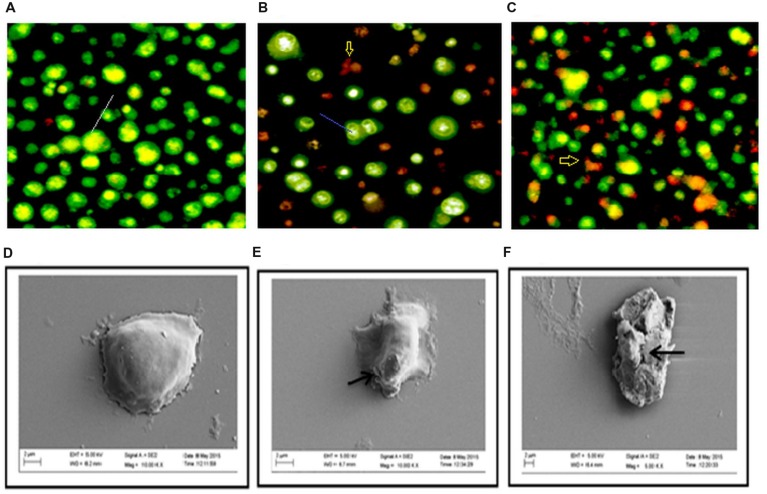
FIGURE 4.
Changes in morphology of DLA cell on treatment with GF was determine by staining untreated and GF treated DLA with AO/EtBr (A–C). Here (A) is the untreated DLA cells (B) DLA cells treated with 150 μg/ml GF and (C) DLA cells treated with 250 μg/ml GF for 3 h. The white arrows are pointing to normal live cells, blue arrows are directing toward cells having shrinked nucleus representing early apoptosis and red arrows are pointing toward cells containing yellowish orange nuclei representing apoptotic cells. (D–F) Scanning electron microscope images of DLA cells afters treatment with GF 150 and 250 μg/ml for 3 h. (D) Control DLA cells. (E) DLA cells treated with GF 150 μg/ml and (F) DLA cells treated with GF 250 μg/ml for 3 h. Untreated DLA are observed to have smooth surface but the DLA cells treated with GF extract are shown have many ruptures on the surface.

