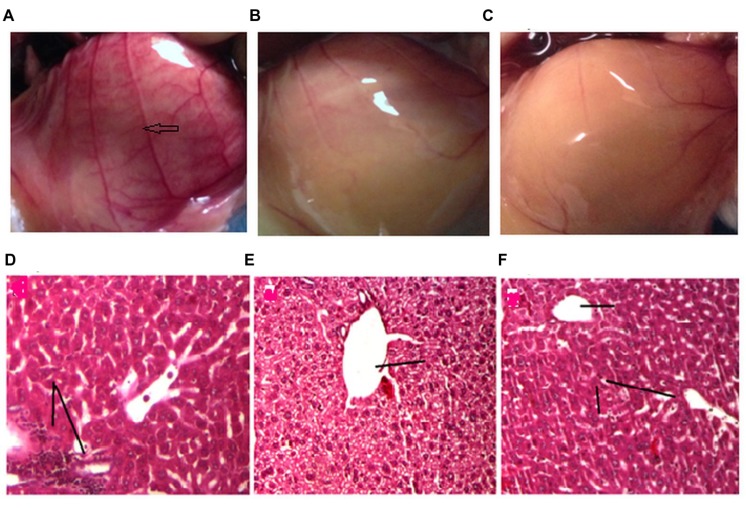
FIGURE 6.
Effect of drug treatment on neo vascularisation (A–C) and liver histology (D–E). The figures (A–C) represent the inner peritoneum lining of untreated, standard treated and GF 200 mg/kg treated DLA induced animals, respectively. The blue arrow is indicating new vasculature in the peritoneum of untreated DLA induced mice. The GF treated and Standard treated animals doesn’t show any significant angiogenesis. (D–F) is the liver histology of DLA induced untreated, standard treated and GF200 mg/kg treated animals.

