FIGURE 7.
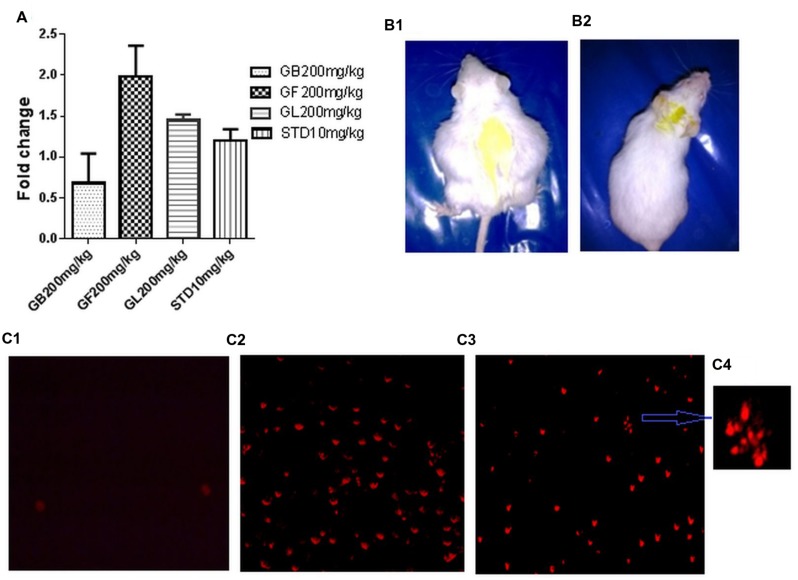
(A) Fold change in in vivo DLA cell death measured by FACS analysis of DLA cells aspirated from the different in vivo experimental group after staining with PI. (B1,2) are pictures of DLA induced untreated and GF 200 mg/kg treated mice after 10 days of drug treatment. (C1–3) represents the fluorescent microscope images of DLA cells aspirated from the untreated, standard treated and GF200 mg/kg treated in vivo experimental groups after staining with PI. (C4) is a zoomed image from (C3) showing apoptotic morphology of GF 200 mg/kg treated group.

