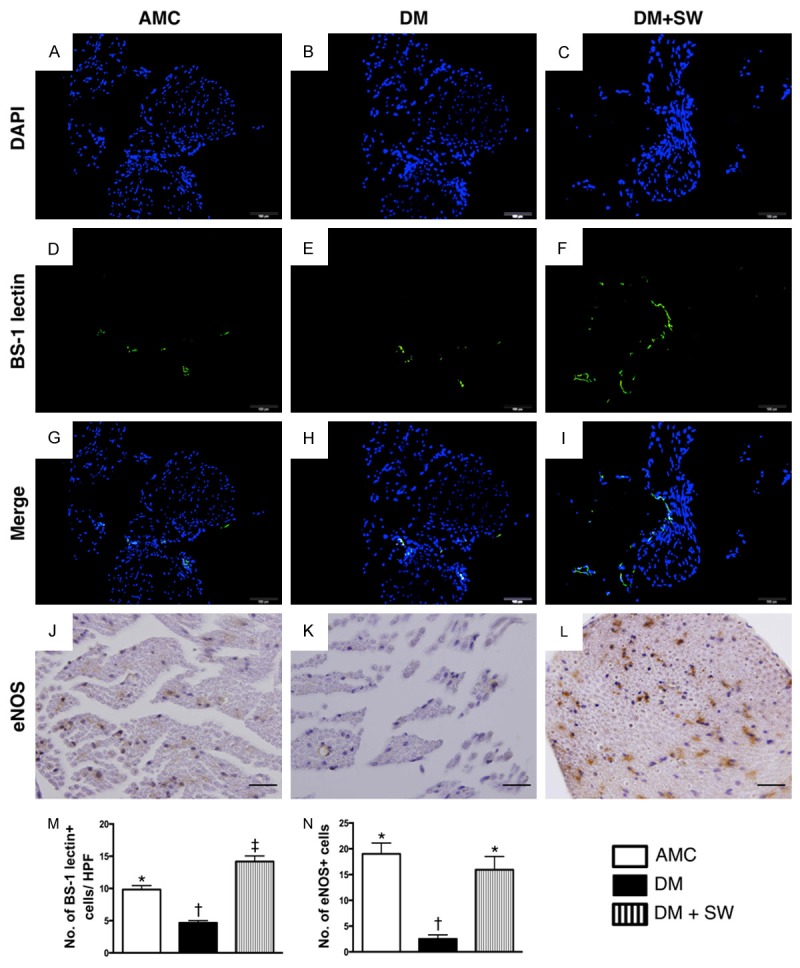
Figure 7.

ECSW therapy augmented the expression of angiogenesis within the sciatic nerve (n=10). (A-H) Illustrating immunofluorecent (IF) microscopic findings (400x), including DAPI (A-C), Bandeirea simplicifolia agglutinin-1 (BS-1) lectin IF staining (D-F) and merge (G to H) for the identification of vascular endothelialization surrounding the sciatic nerve. (M) Statistic analysis for the number of BS-1 lectin+ cells in three groups, * vs. other group with different symbols, p<0.001. (J-L) Illustrating the microscopic findings (400x) of immunohistochemical staining for identifying the number of eNOS+ cells in sciatic nerve (gray color). (N) Statistic analysis for the number of eNOS+ cells in three groups, * vs. other group with different symbols, p<0.001. The scale bars in right lower corner represent 20 µm. All statistical analyses using one-way ANOVA, followed by Bonferroni multiple comparison post hoc test. Symbols (*, †, ‡) indicate significance (at 0.05 level). AMC= aged matched control; DM=diabetes mellitus; SW=shock wave. HPF=high-power field.
