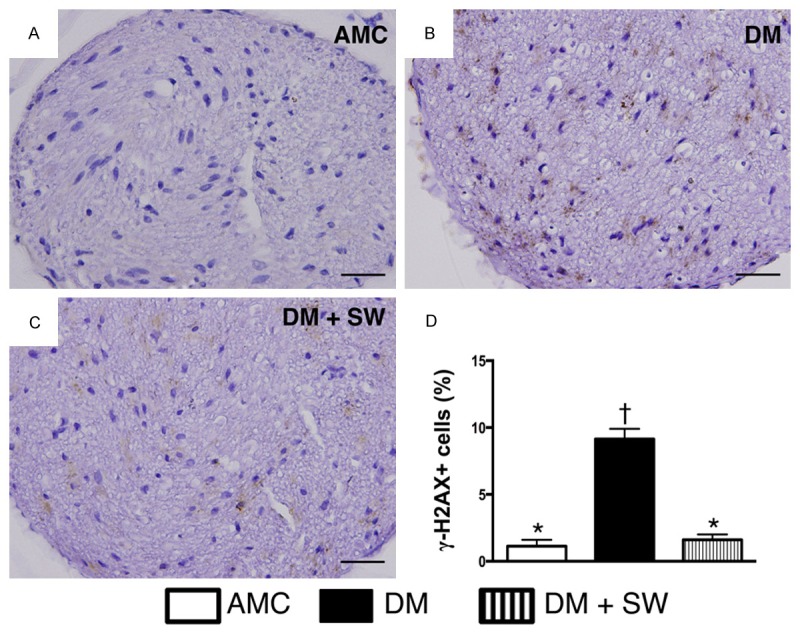
Figure 10.

ECSW therapy attenuated the expression of DNA damaged biomarker in sciatic nerve (n=10). A-C. Microscopic finding (400x) of immunohistochemical (IHC) staining for identification of γ-H2AX (gray color). D. Analytic results of IHC, p<0.0001, * vs. other groups with different symbols (*, †). Scale bars in right lower corner represent 20 µm. All statistical analyses using one-way ANOVA, followed by Bonferroni multiple comparison post hoc test. Symbols (*, †) indicate significance (at 0.05 level). AMC=aged matched control; DM=diabetes mellitus; SW=shock wave.
