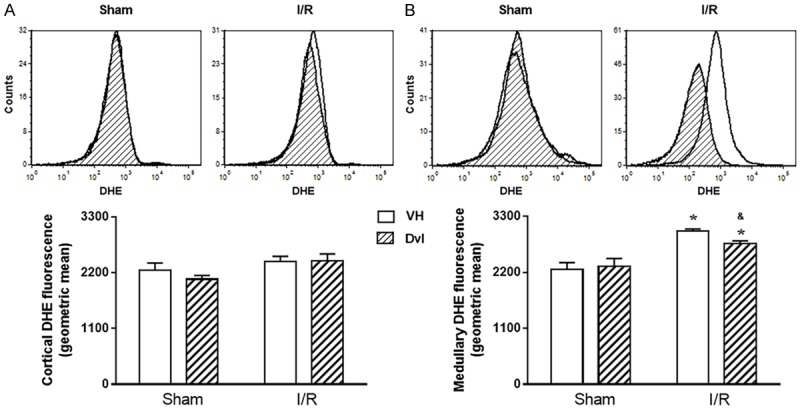
Figure 4.

Production of superoxide anions. Representative histograms from flow cytometric analysis (top panel) using dihydroethidium (DHE) in all studied groups in the renal cortex (A) and medulla (B); the X axis illustrates the fluorescence intensity for the number of counted cells. No changes were observed in quantification of cortical superoxide anion production (A, bottom panel); however, a remarkable increase in DHE fluorescence was observed in medullary IR vehicle-treated animals, which was partially attenuated by Dvl treatment (B, bottom panel). N=5-6. Values are means ± SEM. *p<0.05 vs.sham group; &p<0.05 vs. IR VH. Two-way ANOVA followed by Tukey’s post hoc test.
